AutoDraw

Heart Health Blood Test
Test and track your heart health with our at-home heart health blood test.
10 Biomarkers
£76
22 mins read
We looked at thousands of blood test results to analyse the state of heart health in the UK in 2025.
Written by Sarah Bolt
January 28, 2025
Reviewed by:
Dr Thom Phillips
I am delighted to share Forth’s first Heart Health Report, an in-depth analysis of cardiovascular well-being based on nearly 20,000 blood test results from across the UK. At Forth, we believe that knowledge is power, and our mission is to empower individuals with the tools and insights they need to better understand their health and extend their health span.
This report is powered by our proprietary HealthCoach™ technology launched in April 2024. It is the first in a series of ten reports that will explore the nation’s health across key areas.
Heart health is central to overall well-being. Cardiovascular disease (CVD) remains the leading cause of death globally, and in the UK alone, one in four premature deaths is attributed to CVD. According to the British Heart Foundation, 7.6 million people in the UK live with heart and circulatory diseases, highlighting the scale of this public health issue.
The stakes are high: poor heart health not only impacts life expectancy but also diminishes quality of life. However, most cardiovascular risks are modifiable. Through early detection, personalised interventions, and lifestyle changes, individuals can significantly reduce their risk of heart disease. This report underscores the importance of understanding key biomarkers like glucose control, cholesterol levels, inflammatory markers, and sex steroid hormones—all critical drivers of cardiovascular health.
At the heart of this report is our HealthCoachTM technology. By transforming complex biomarker data into clear, actionable health scores, HealthCoachTM empowers individuals to take control of their health like never before. It simplifies the interpretation of clinical blood test results, providing personalised scores and guidance across ten key health categories. This groundbreaking tool aims to bridge the gap between medical data and meaningful lifestyle changes, enabling better health outcomes for everyone.
The findings of this report underscore the importance of prioritising heart health at every stage of life but particularly as you start to get older, and for women when they enter the menopause. As the first in a series of ten health reports, this study lays the groundwork for a deeper understanding of the nation’s well-being. At Forth, we remain committed to providing data-driven insights and software tools that empower individuals to lead healthier, longer lives.
Together, let’s take control of our health—starting with the heart.
Sarah Bolt
CEO & Co-founder, Forth
Every year, thousands of people across the UK use Forth home blood tests to check and monitor their health. This annual heart health report is based on insights gained from almost 20,000 blood test results which generated an overarching heart health score for 2,600 adults.
The Heart Health Score, calculated using our proprietary HealthCoachTM technology, provides a comprehensive measure of cardiovascular well-being. Developed to increase the understanding of personal health, HealthCoachTM translates clinical biomarker data into health scores across 10 key categories. By transforming complex data into clear and meaningful health metrics, this software tool enables easier interpretation of blood test results, providing actionable insights and scores to help individuals take proactive steps toward better health.
Before we dive into the data, let’s first explain how we calculate the scores.
Learn More About HealthCoachThe overall Heart Health Score is calculated as a number out of 100 using four key components. Each component is made up of one or more biomarkers.
Each of these components is scored out of 100 based on the blood test results of each biomarker, the higher the score the better the result. These individual scores are weighted and combined into an overall Heart Health Score. Scores are categorised as follows:
Customers can access their personalised scores and insights through the Forth app, enabling them to track improvement in their health scores.
Almost a third of people need to improve their overall heart health.
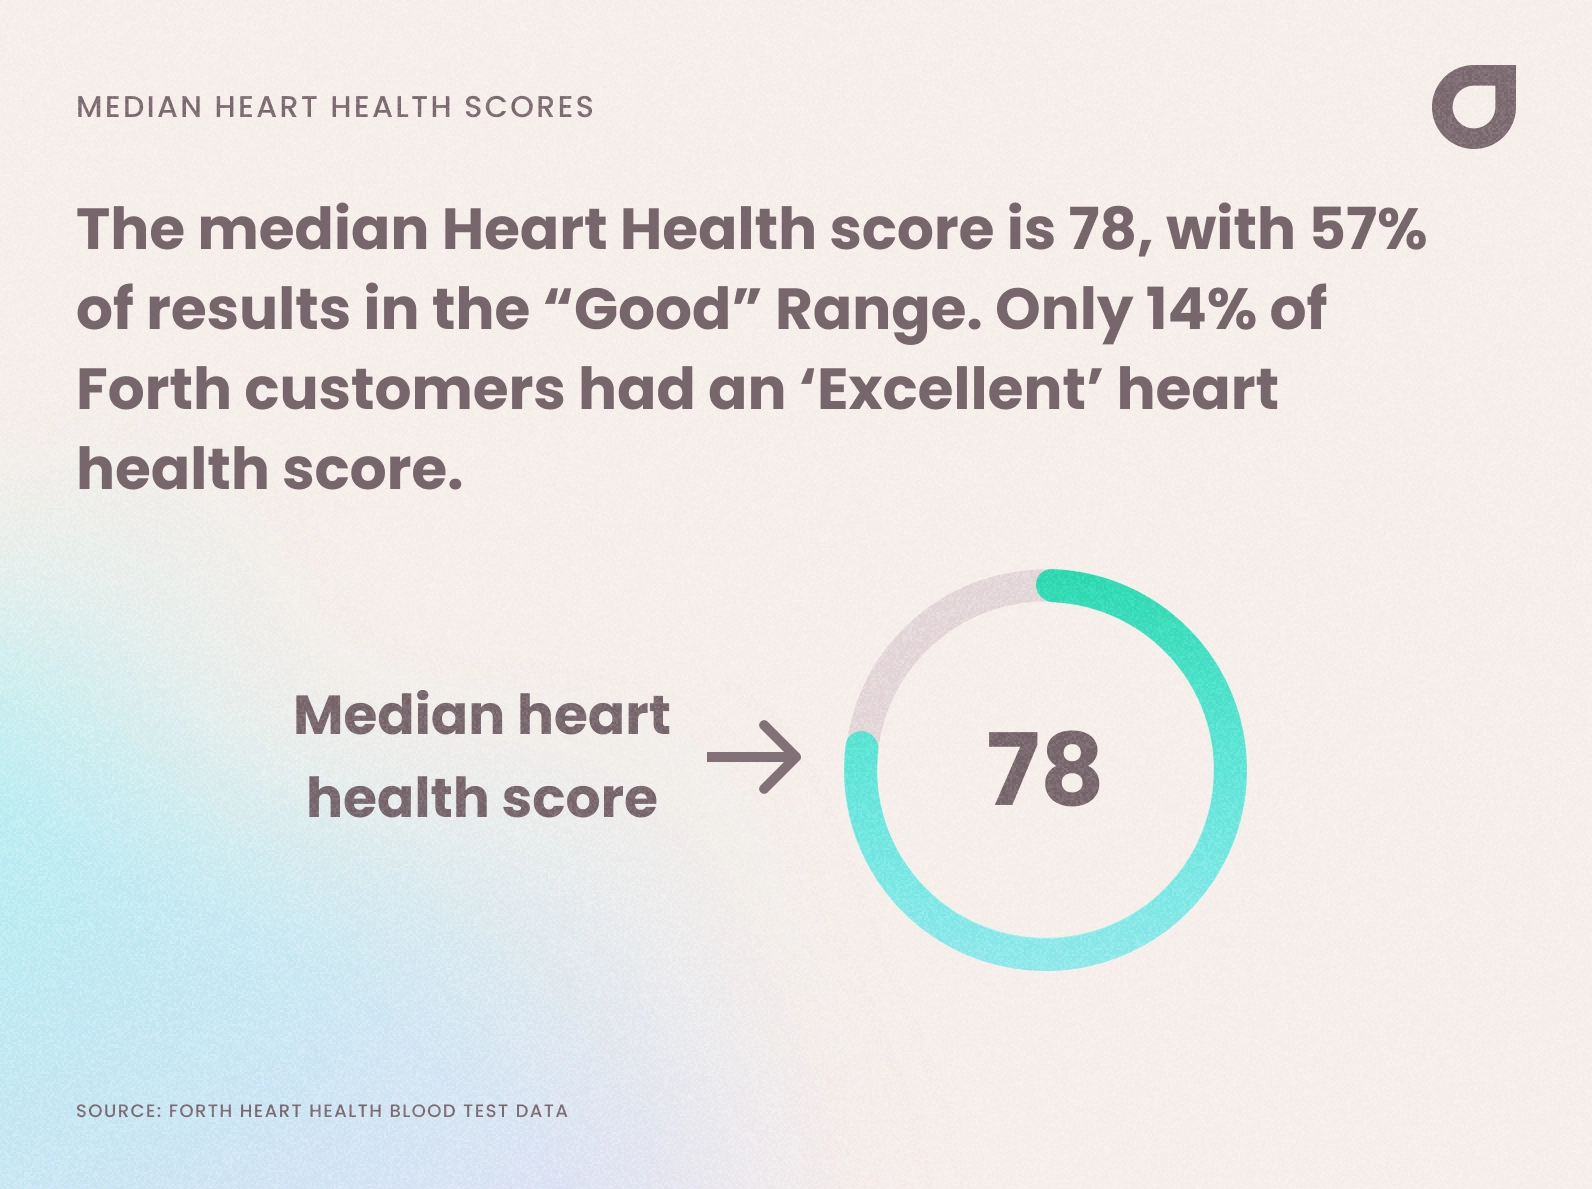
Nearly a third of people would benefit from improving their cardiovascular health, with 28% scoring below 71 on our Heart Health Score, indicating room for improvement.
On the other hand, only 14% achieved an ‘Excellent’ score, while the majority (57%) fell into the ‘Good’ category. The median Heart Health Score was 78, highlighting that most people could benefit from lifestyle adjustments such as improved diet, weight management, reduced alcohol consumption, or increased physical activity.
| Table 1: % Heart Health Score Breakdown by Category | |
| Category | % of Results |
| Excellent (91-100) | 14% |
| Good (71-90) | 57% |
| Improvable (51-70) | 23% |
| Somewhat Low (26-50) | 5% |
| Needs Attention (0-25) | >1% |
Based on blood test data from 2,600 Forth customers
While overall scores provide a broad overview, analysing individual components offers a more detailed understanding and insight into the specific areas of biological health that require attention and improvement.
As part of our heart health report, we analysed the differences in heart health scores across genders and age groups. The findings reveal:
Women consistently score poorer than men when reaching 50+ years of age.
Heart health scores decline with age, from a median of 83 in the 18-29 yr old age bracket to 73 at 60+ years of age.
| Table 2: Heart Health Scores by Age and Gender | |||
| Age Group | Female | Male | Average |
| 18-29 | 82 | 84 | 83 |
| 30-39 | 82 | 80 | 80 |
| 40-49 | 78.5 | 76 | 78 |
| 50-59 | 75 | 77 | 75 |
| 60+ | 70.5 | 74.5 | 73 |
Based on blood test data from 2,600 Forth customers
"The biggest reduction in score in our data occurs in women aged 50-59, which would fit with being around the [peri-]menopause: 82→75. According to the British Heart Foundation, one in fourteen women die from coronary heart disease (CHD) in the UK per year. It may also surprise you to learn that CHD kills more than twice as many women in the UK as breast cancer so it’s a big problem. Unfortunately, often the first symptom of CHD is a heart attack, at which point it’s a little late! Research has suggested that the changes in hormones that happen during menopause can affect the way cholesterol is processed, increasing women’s risk closer to that of a man of a similar age."
Glucose Control Concerns: Nearly Half of Men and 41% of Women at Risk
Our findings reveal that 41% of women and 49% of men scored 70 or below for glucose control, indicating a significant portion of the population struggles with maintaining healthy blood sugar levels. This pattern is consistent with data from a 2011 BMJ study[1], which reported that 35.3% of adults in England exhibited pre-diabetes indicators.
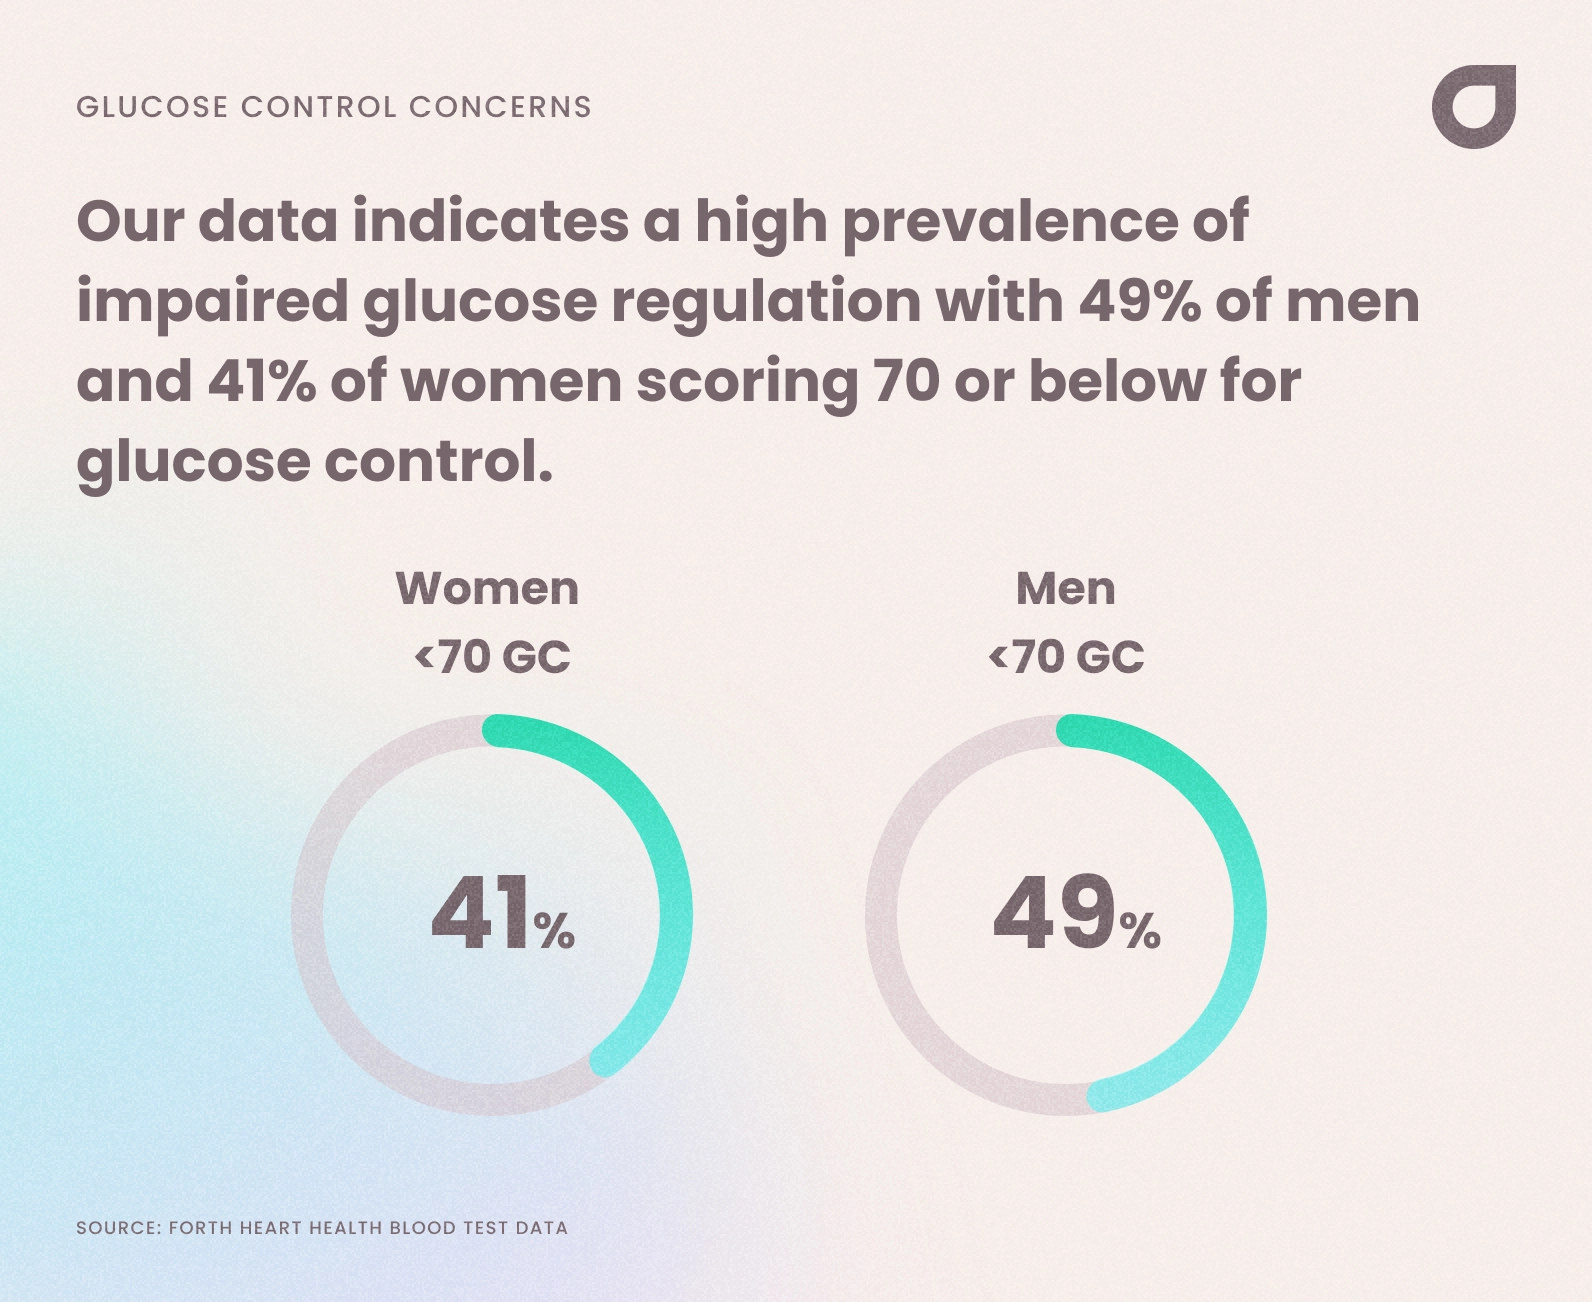
While these scores are not diagnostic of pre-diabetes, they highlight the prevalence of impaired glucose tolerance among UK adults. Factors such as sedentary lifestyles and poor dietary habits are major contributors to this issue, underlining the importance of early intervention to mitigate the risk of developing type 2 diabetes and associated cardiovascular complications.
| Table 3: Glucose Control Scores by Gender & Category | |||||||
| Component | Sex | Median Score | % Excellent | % Good | % Improvable | % Somewhat low | % Needs attention |
| Glucose Control | Female | 72 | 22% | 37% | 27% | 12% | 3% |
| Glucose Control | Male | 72 | 18% | 34% | 33% | 13% | 2% |
Based on blood test data from 2,600 Forth customers
HbA1c, or glycated haemoglobin, is a blood test that provides a measure of average blood sugar levels over the past two to three months. It is a valuable tool for assessing the effectiveness of glucose control in individuals with diabetes and for evaluating their risk of developing cardiovascular complications. Technically, ‘pre-diabetes’ isn’t really a term that’s used very often in the UK – doctors use the term non-diabetic hyperglycaemia – but a higher than normal HbA1c is a really valuable marker for identifying people at risk and preventing the onset of type 2 diabetes.
When blood sugar levels are consistently high, glucose molecules can bind to haemoglobin, a protein found in red blood cells. This process, known as glycation, forms HbA1c. The higher the level of HbA1c, the greater the average blood sugar levels over the past few months. Therefore, HbA1c is often used to monitor the long-term control of diabetes.
Individuals with poorly controlled diabetes are at increased risk of developing cardiovascular complications, including heart disease, stroke, cognitive decline, and kidney disease. HbA1c has been shown to be a strong predictor of cardiovascular risk in people with diabetes. Studies have consistently demonstrated that higher HbA1c levels are associated with a greater risk of heart attack, stroke, and other cardiovascular events.
Several mechanisms contribute to the link between HbA1c and cardiovascular risk. High blood sugar levels can damage blood vessels, leading to the formation of atherosclerotic plaques. These plaques can narrow the arteries, restricting blood flow and increasing the risk of heart attack and stroke. Additionally, high blood sugar levels can contribute to inflammation throughout the body, which can further increase the risk of cardiovascular disease.
Moreover, poorly controlled diabetes can lead to other cardiovascular risk factors, such as hypertension and elevated cholesterol levels. These factors, in combination with high HbA1c levels, can significantly increase the risk of cardiovascular complications.
Maintaining a low HbA1c level is crucial for reducing the risk of cardiovascular disease in individuals with diabetes. This can be achieved through a combination of lifestyle modifications and medical interventions. A healthy diet, regular physical activity, and weight management are essential for improving glucose control and reducing cardiovascular risk. In some cases, medication may be necessary to help manage blood sugar levels.
By maintaining a low HbA1c level, you can significantly reduce your risk of heart disease, stroke, and other cardiovascular complications. Regular monitoring of HbA1c levels and working with your GP, practice nurses, health coach and personal trainers to develop a personalised treatment plan to keep your insulin sensitivity high and the risk of type 2 diabetes low.
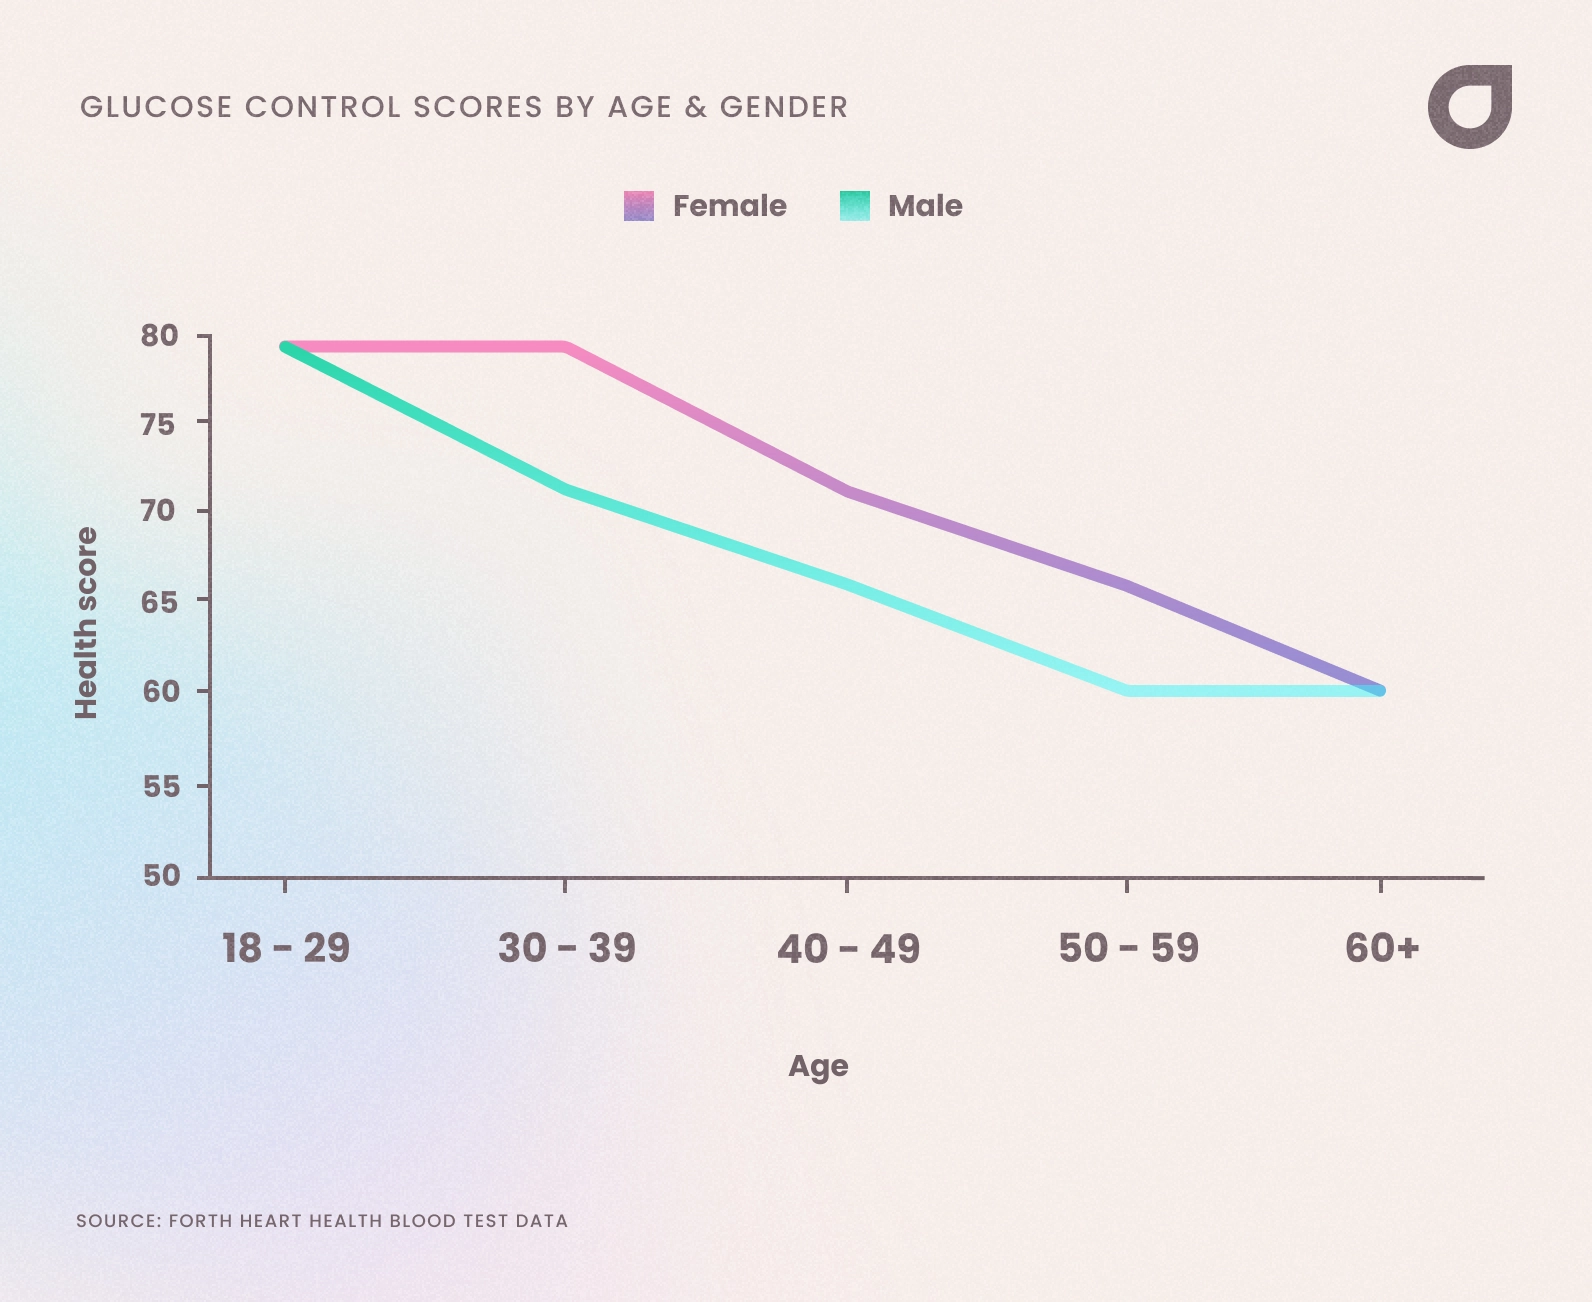
Glucose control scores steadily decline with age for both men and women, reflecting the impact of ageing on the body’s ability to regulate blood sugar. While women generally exhibit slightly better scores than men in the 30–59 age group, both genders experience a noticeable drop as they grow older.
The overall median glucose control score for both genders above 60 years old is 60. This is a significant drop from 79 in the 18-29 year old age bracket, emphasising that glucose regulation becomes a key area of focus for most individuals as they age.
| Table 4: Glucose Control Scores by Age & Gender | |||
| Median Glucose Control Scores | |||
| Age Bracket | Female | Male | Median for Age Bracket |
| 18-29 | 79 | 79 | 79 |
| 30-39 | 79 | 72 | 79 |
| 40-49 | 72 | 66 | 72 |
| 50-59 | 66 | 60 | 66 |
| 60+ | 60 | 60 | 60 |
| Median for Sex | 72 | 72 | 72 |
Based on blood test data from 2,600 Forth customers
As people age, their metabolism tends to slow down. This affects how the body processes glucose and can lead to reduced insulin sensitivity, making it harder to maintain stable blood sugar levels. Insulin resistance becomes more common, especially after age 40, which might explain why glucose control worsens in older age brackets.
Younger individuals typically have higher levels of physical activity, which helps improve glucose metabolism and overall blood sugar regulation. As people age, they tend to become less physically active, contributing to worse glucose control. Sedentary lifestyles in older adults can further accelerate glucose regulation issues.
Changes in diet, particularly higher intake of processed foods, sugars, and refined carbohydrates, can contribute to poorer glucose control. Younger people might be more conscious about their diet or have a faster metabolism to compensate, but over time, dietary habits can negatively affect blood sugar control. Additionally, older adults may consume fewer nutrients essential for maintaining proper glucose metabolism, such as fibre.
Hormonal changes in ageing, particularly during menopause for women can also affect glucose metabolism. In women, declining oestrogen levels can lead to reduced insulin sensitivity, while for men, lower testosterone levels can contribute to increased fat storage and decreased muscle mass, both of which can worsen glucose control.
As people age, they are more likely to develop chronic health conditions, such as type 2 diabetes, cardiovascular diseases, or metabolic syndrome. These conditions directly impact the body’s ability to control glucose levels. The rise in chronic disease incidence with age helps explain the worsening glucose control scores in older adults.
Older adults are more likely to be on medications that can affect glucose levels, such as corticosteroids, beta-blockers, and antidepressants. These medications can interfere with insulin production or glucose uptake, leading to poorer glucose control over time.
Encouraging Inflammation Scores: Low Across Both Genders
Reassuringly, our data shows that just 16% of women and 9% of men scored 70 or below for inflammatory markers, indicating low levels of chronic inflammation in most individuals.
Cardiovascular disease (CVD), often referred to as the “silent killer,” can begin to develop much earlier than many realise. It is not uncommon to observe poor inflammatory scores in individuals as young as their 30s.
As inflammation plays a key role in the development of chronic diseases, including CVD, understanding personal inflammation levels is therefore crucial for identifying risks early and extending healthspan.
| Table 5: Inflammation Scores by Gender & Category | |||||||
| Component | Sex | Median. Score | % Excellent | % Good | % Improvable | % Somewhat low | % Needs attention |
| Inflammatory Markers | Female | 100 | 79% | 5% | 5% | 7% | 5% |
| Inflammatory Markers | Male | 100 | 87% | 4% | 2% | 4% | 2% |
Based on blood test data from 2,600 Forth customers
High-sensitivity C-reactive protein (hs-CRP) is a blood test used to measure the level of inflammation in the body. It is a biomarker of systemic inflammation, which is linked to a variety of health conditions, including cardiovascular disease.
Elevated levels of hs-CRP have been consistently associated with an increased risk of heart attack and stroke. This relationship is thought to be due to the role of inflammation in the development of atherosclerosis, a condition characterised by the build up of plaque in the arteries. Chronic inflammation can lead to damage to the blood vessel walls, promoting the formation of atherosclerotic plaques, which can narrow the arteries and restrict blood flow.
Several factors can contribute to elevated hs-CRP levels, including obesity, diabetes, smoking, and chronic stress. These conditions can trigger inflammatory processes in the body, leading to increased production of hs-CRP. Additionally, hs-CRP levels can be influenced by infections, autoimmune diseases, and other inflammatory conditions.
It is important to note that while hs-CRP is a useful marker of inflammation and cardiovascular risk, it is not a definitive diagnostic test. Other factors, such as cholesterol levels, blood pressure, and family history, also play a role in determining an individual’s risk of heart disease.
The Omega-3 to Omega-6 ratio refers to the balance between two types of essential fatty acids in the human diet: omega-3 fatty acids and omega-6 fatty acids. Both omega-3 and omega-6 fatty acids are necessary for the body’s proper functioning, but maintaining a balanced ratio between them is crucial for optimal health.
Omega-3 fatty acids are found in foods like fatty fish (salmon, mackerel, sardines), flaxseeds, chia seeds, and walnuts. They are known for their anti-inflammatory properties and have been associated with various health benefits. Omega-6 fatty acids are found in foods like vegetable oils (soybean oil, corn oil, sunflower oil), nuts, and seeds. While they also play important roles in the body, excessive consumption of omega-6s relative to omega-3s can lead to an imbalance that promotes inflammation and may contribute to various health issues.
The ideal omega-3 to omega-6 ratio is debated among experts, but it is generally recommended to have a lower ratio of omega-6s to omega-3s, ideally around 4:1 or even lower. However, in many modern Western diets, the ratio can be as high as 20:1 or more, primarily due to the overconsumption of processed foods rich in omega-6 fatty acids and the underconsumption of foods rich in omega-3s.
An imbalanced omega-3 to omega-6 ratio has been linked to chronic inflammatory conditions, cardiovascular diseases, certain cancers, and other health problems. Therefore, maintaining a balanced intake of these essential fatty acids is important for overall health and well-being.
Inflammatory marker scores generally tend to be slightly poorer in women across all age brackets, with men consistently showing higher scores. Scores decrease only modestly with age.
| Table 6: Inflammation Scores by Age & Gender | |||
| Median Inflammatory Marker Scores | |||
| Age Bracket | Female | Male | Median for Age Bracket |
| 18-29 | 90 | 92 | 91 |
| 30-39 | 88 | 94 | 91 |
| 40-49 | 90 | 94 | 92 |
| 50-59 | 89 | 93 | 91 |
| 60+ | 87 | 92 | 89 |
| Median for Sex | 89 | 93 | 91 |
Based on blood test data from 2,600 Forth customers
The slight increase in inflammatory marker scores with age, as seen in this data, aligns with well-established biological processes. Inflammation tends to rise as part of the ageing process, here are a few factors that influence this change:
As we age, the immune system experiences a decline in function, known as immunosenescence. This makes the body less effective at controlling chronic inflammation. Over time, even low-level inflammation, which the immune system is unable to fully resolve, can lead to higher inflammatory marker scores.
Ageing is accompanied by the accumulation of cellular and tissue damage due to long-term exposure to environmental factors (e.g., UV radiation, pollution, poor diet). This damage can trigger chronic inflammatory responses, as the body attempts to repair itself, which elevates inflammatory markers.
As people get older, they are more likely to develop chronic conditions such as obesity, cardiovascular disease, diabetes, and arthritis. These conditions often have inflammatory components, which contribute to higher scores. Additionally, lifestyle factors like reduced physical activity and dietary changes in older age can increase inflammation.
For females, the slight decline in inflammatory markers after age 60 may be partially explained by hormonal changes post-menopause. Oestrogen has anti-inflammatory properties, and its decline can initially cause a spike in inflammation during menopause.
Over time, metabolic processes slow down, leading to increased oxidative stress, which contributes to chronic low-grade inflammation.
A Gender Gap exists in Cholesterol Management: Men at Greater Risk
Our data reveals a striking gender disparity in lipid health, with more than twice the number of men (36%) scoring 70 or below compared to just 16% of women.
One reason for this may be that pre-menopausal women benefit from the protective effects of oestrogen, which supports cholesterol regulation by reducing LDL[2] (bad cholesterol) levels and increasing HDL (good cholesterol). As a result, women generally exhibit healthier lipid profiles compared to men.
These findings are consistent with national trends[3], including the widespread use of cholesterol-lowering medications such as Atorvastatin in the UK, highlighting the significant need for cholesterol management, particularly among men.
| Table 7: Lipid Scores by Gender & Category | |||||||
| Component | Sex | MedianScore | % Excellent | % Good | % Improvable | % Somewhat low | % Needs attention |
| Lipids | Female | 91 | 50% | 34% | 10% | 5% | 0% |
| Lipids | Male | 79 | 26% | 38% | 20% | 14% | 2% |
Based on blood test data from 2,600 Forth customers
LDL is often labelled as ‘bad cholesterol’ due to its associative link with cardiovascular events. The relationship between LDL and heart disease is a little more complex than this, but increasingly aggressive management of LDL levels are being promoted by experts in cardiology and atherosclerosis. In North America, the target LDL level for people who have not already had a cardiac event (known as primary prevention) should be <2.6mmol/L. However, the most recent opinion from the European Atherosclerosis Society (EAS) and American Heart Association suggests that there is no lower target for LDL-c; i.e. the lower the better for addressing long-term cardiovascular disease risk.
High-density lipoprotein (HDL) is another class of lipoprotein that carries cholesterol in the blood. If HDL is less than 1.0 mmol/L there is an increased risk of heart disease that is independent of other risk factors, and an HDL level around 1.5-1.6 mmol/L has been shown to be protective against cardiac disease. However, this protective effect has a ceiling, and it’s been shown that levels over 2.3mmol/L behave more like LDL and can promote plaque formation. Higher than desirable HDL levels can often be seen in those who frequently drink alcohol.
Most triglycerides are found in fat, but some triglycerides circulate in the blood to provide fuel for muscles to work. After a person eats or exercises the circulating levels of triglycerides transiently increase as they’re shunted around the body for use as fuel or ready for storage. As triglycerides are one of our main energy sources we have two supplies – one from our diet and one supply made in the body by our liver. Because Triglyceride levels are so sensitive to anything we eat or when we exercise, they’re also another useful tool for understanding how sensitive your body is to insulin. They can be used as an early warning flag for worsening glucose control due to poor diet and being sedentary.
This is shown in the scientific literature, where Triglyceride (TG) to high-density lipoprotein (HDL) ratio values >2.75 in men and >1.65 in women were found to be highly predictive of the metabolic syndrome diagnosis[4]. TG/HDL ratio was also found to have a high predictive value of a first coronary event (Heart attack, MI, Angina) regardless of BMI.
As you can see, these three markers all have a profound impact on the risk of developing atherosclerosis (hardening of the arteries), which is at the heart of the development of cardiovascular disease, dementia and ultimately, early death.
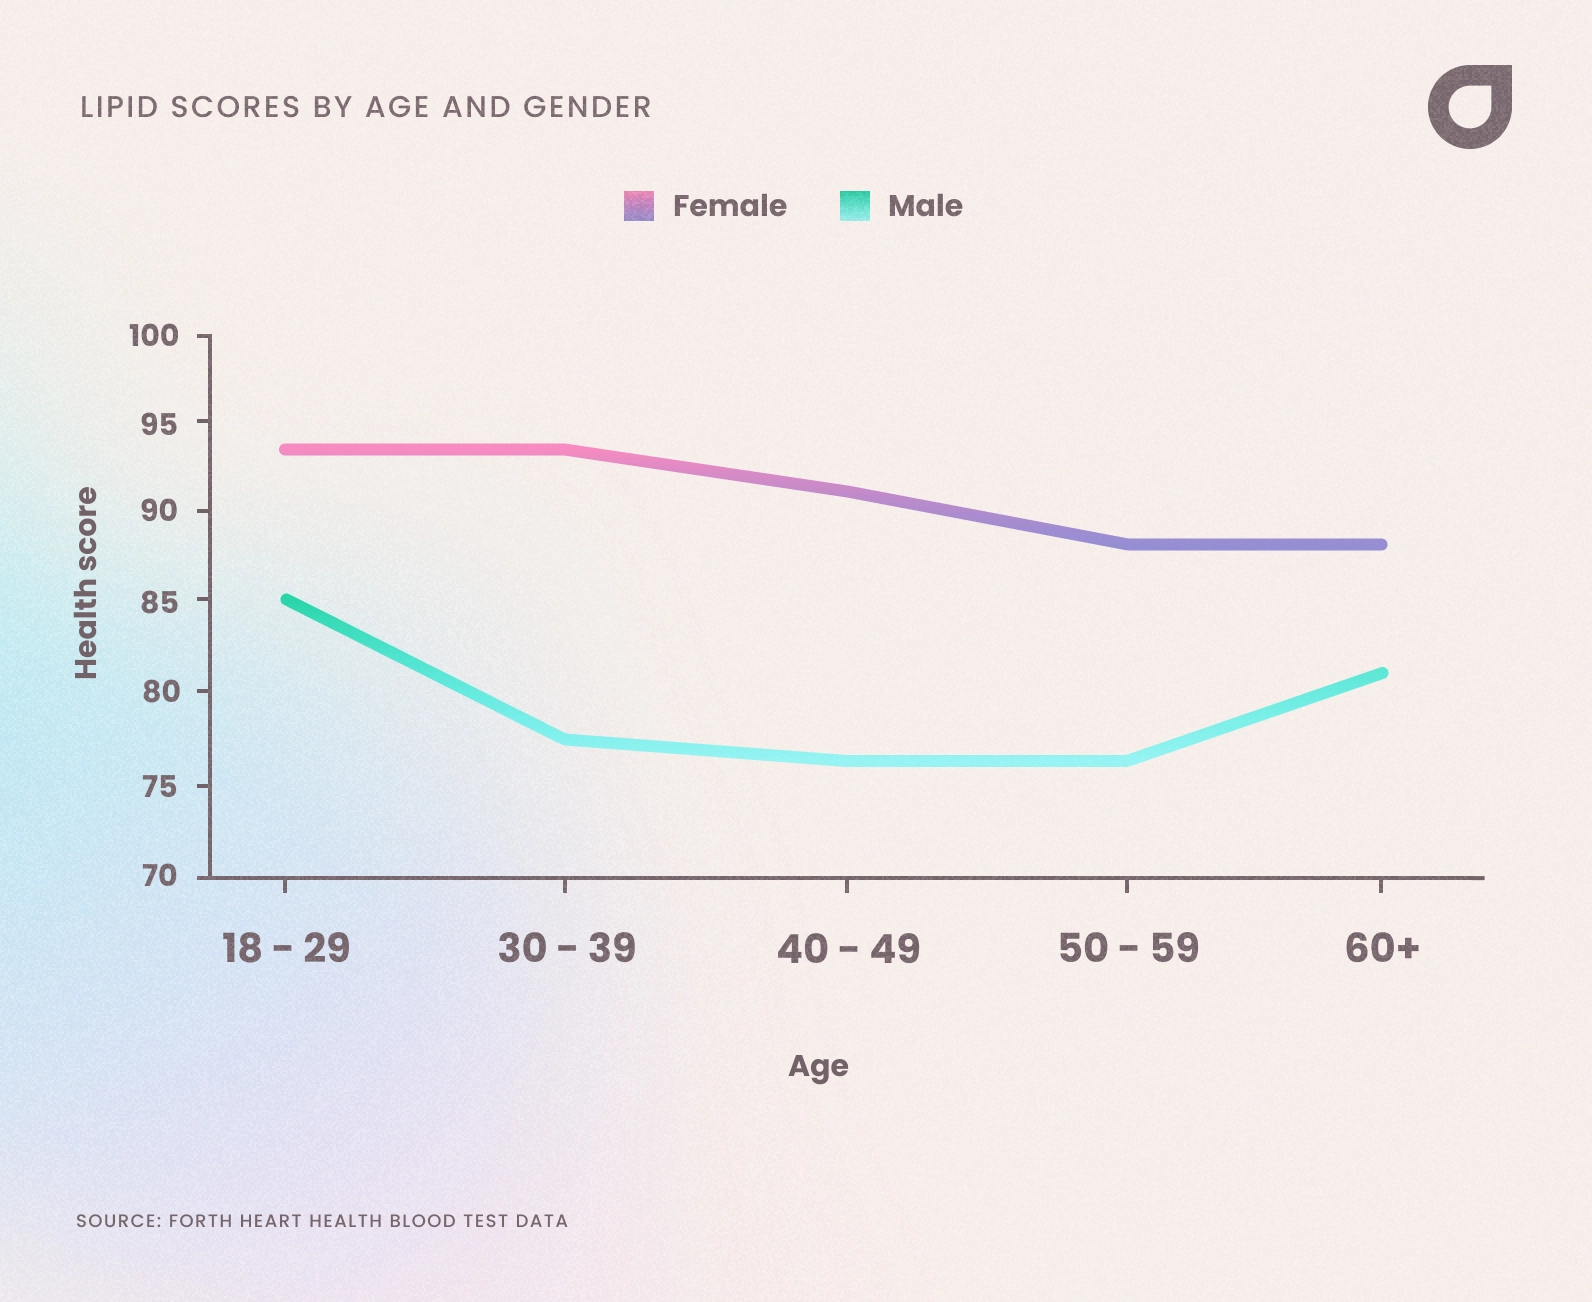
Lipid scores decline steadily with age, reflecting the cumulative effects of metabolic changes and lifestyle factors. The youngest age group (18–29) demonstrates the highest scores, with a median of 93 for women and 85 for men, highlighting better cholesterol regulation in early adulthood.
As individuals age, lipid scores gradually decrease. This trend is most noticeable in men, though both genders experience declines. By the 60+ age bracket, scores stabilise at lower levels, with a median of 88 for women and 81 for men.
| Table 8: Lipid Scores by Age & Gender | |||
| Median Lipid Scores | |||
| Age Bracket | Female | Male | Median for Age Bracket |
| 18-29 | 93 | 85 | 88 |
| 30-39 | 93 | 77 | 88 |
| 40-49 | 91 | 76 | 85 |
| 50-59 | 88 | 76 | 85 |
| 60+ | 88 | 81 | 85 |
| Median for Sex | 91 | 79 | 87 |
Based on blood test data from 2,600 Forth customers
The results show a general trend where lipid health scores tend to get poorer with age for both men and women, but the drop is greater for men. Several factors may explain why lipid scores change over time and why there are differences between genders:
As we age, our body’s metabolism slows down, affecting how we process fats and cholesterol. This slower metabolism often leads to a gradual rise in LDL (“bad” cholesterol) and a decrease in HDL (“good” cholesterol). This shift can negatively affect lipid scores as we age, making them “worse” in terms of cardiovascular health.
Lifestyle changes with age can also play a major role in lipid score variations. As people age, they may experience changes in diet, reduced physical activity, or gain weight—all of which can worsen lipid profiles.
In younger adults, lipid scores might be healthier due to more active lifestyles or higher muscle mass, which burns fat more efficiently.
In middle and older age groups, many people experience weight gain, reduced physical activity, and a higher intake of saturated fats, all of which can negatively impact lipid levels.
Smoking also has a direct impact on a person’s cholesterol profile. Research has shown that heavier smokers had higher levels of total cholesterol, triglycerides, LDL, and VLDL than lighter smokers. Conversely, as smoking intensity increased, HDL levels decreased.
Hormones play a significant role in cholesterol management, and this could explain why women generally have higher lipid scores than men in this data set.
In premenopausal women, oestrogen helps maintain higher levels of HDL, which is protective against heart disease. After menopause, however, oestrogen levels drop, which can negatively affect lipid scores, though women still generally maintain better scores than men at comparable ages. This is one area where the benefits of HRT are sometimes overlooked where replacing lost oestrogen maintains its protective effect on cholesterol metabolism.
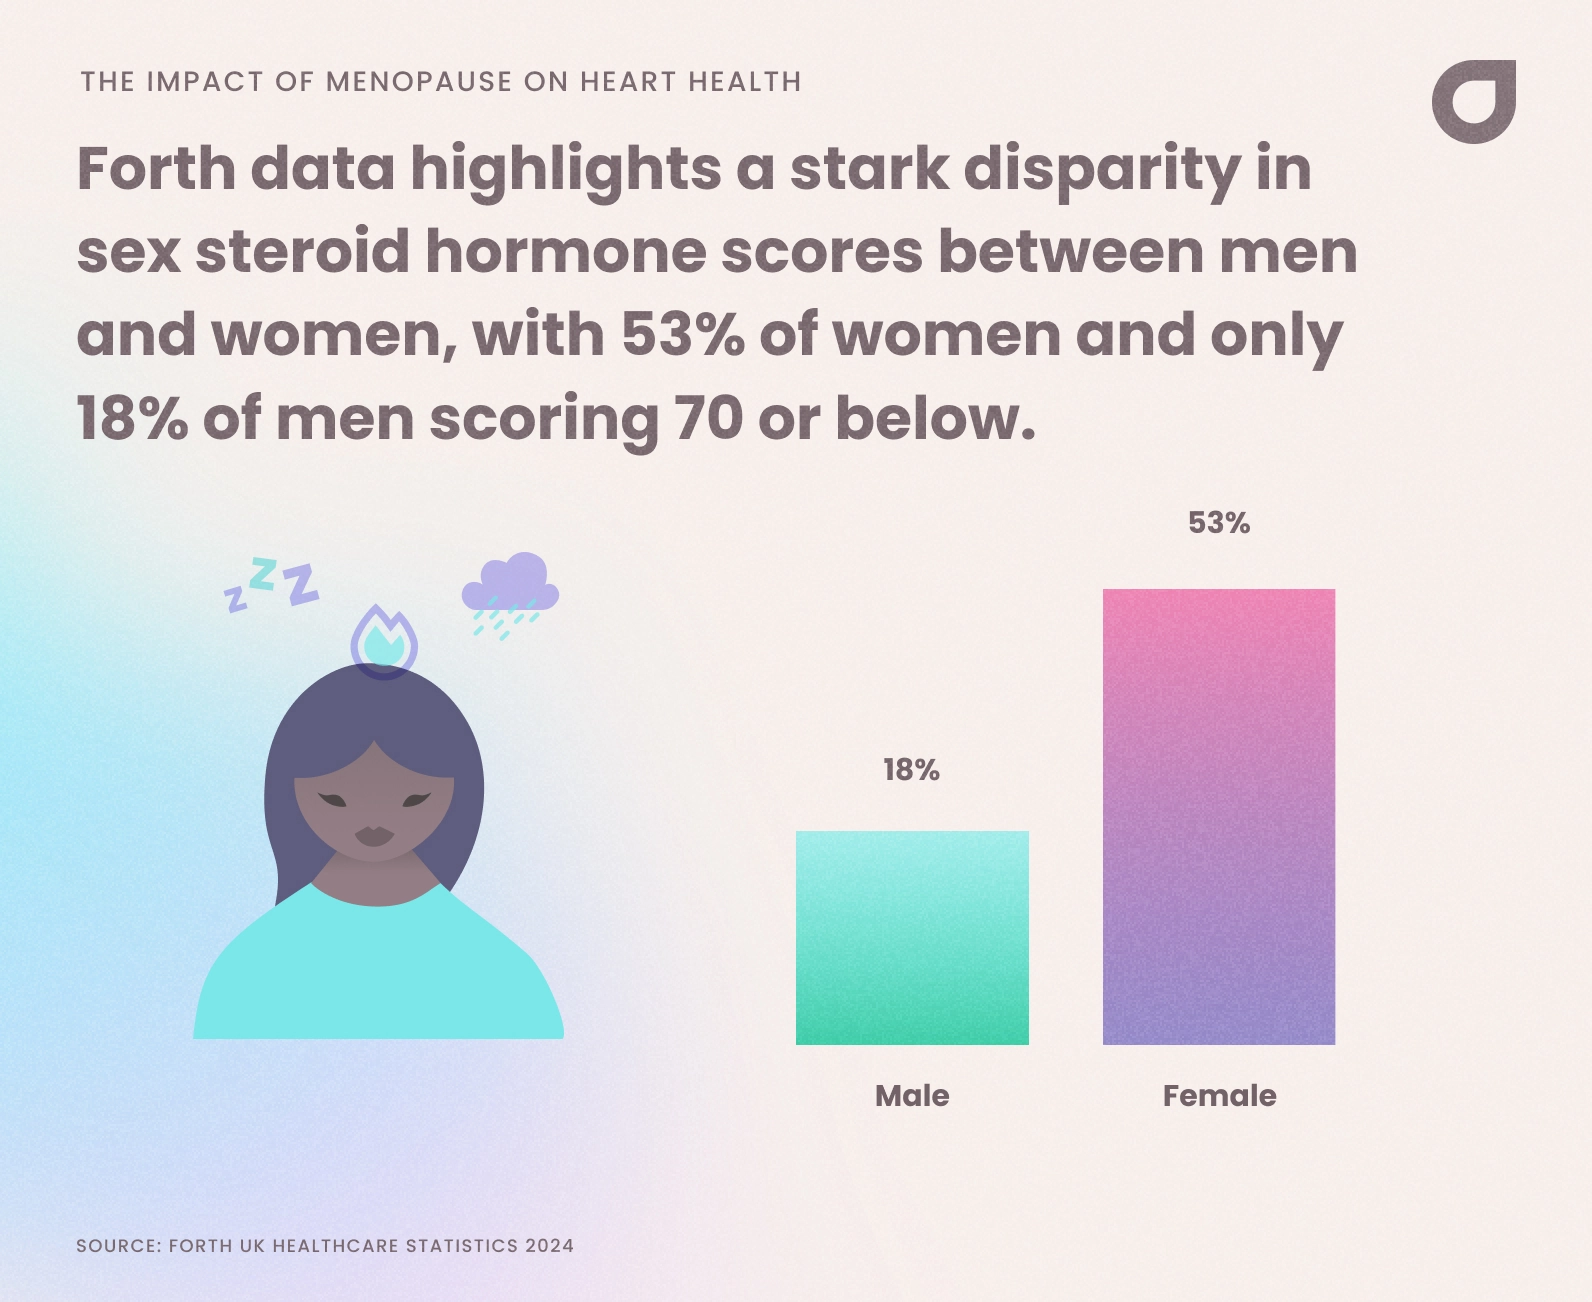
The Impact of Menopause: Women’s Heart Health Scores Plummet Post-50
Our data highlights a stark disparity in sex steroid hormone scores between men and women, with 53% of women and only 18% of men scoring 70 or below, with the overall median hormone score of women at 67, compared to 93 for men. This disparity reflects the profound hormonal changes associated with reproductive ageing, specifically menopause in women.
| Table 9: Sex Steroid Scored by Category | |||||||
| Component | Sex | Median Score | % Excellent | % Good | % Improvable | % Somewhat low | % Needs attention |
| Sex Steroid Hormones | Female | 67 | 24% | 23% | 14% | 10% | 29% |
| Sex Steroid Hormones | Male | 93 | 58% | 24% | 8% | 8% | 2% |
Based on blood test data from 2,600 Forth customers
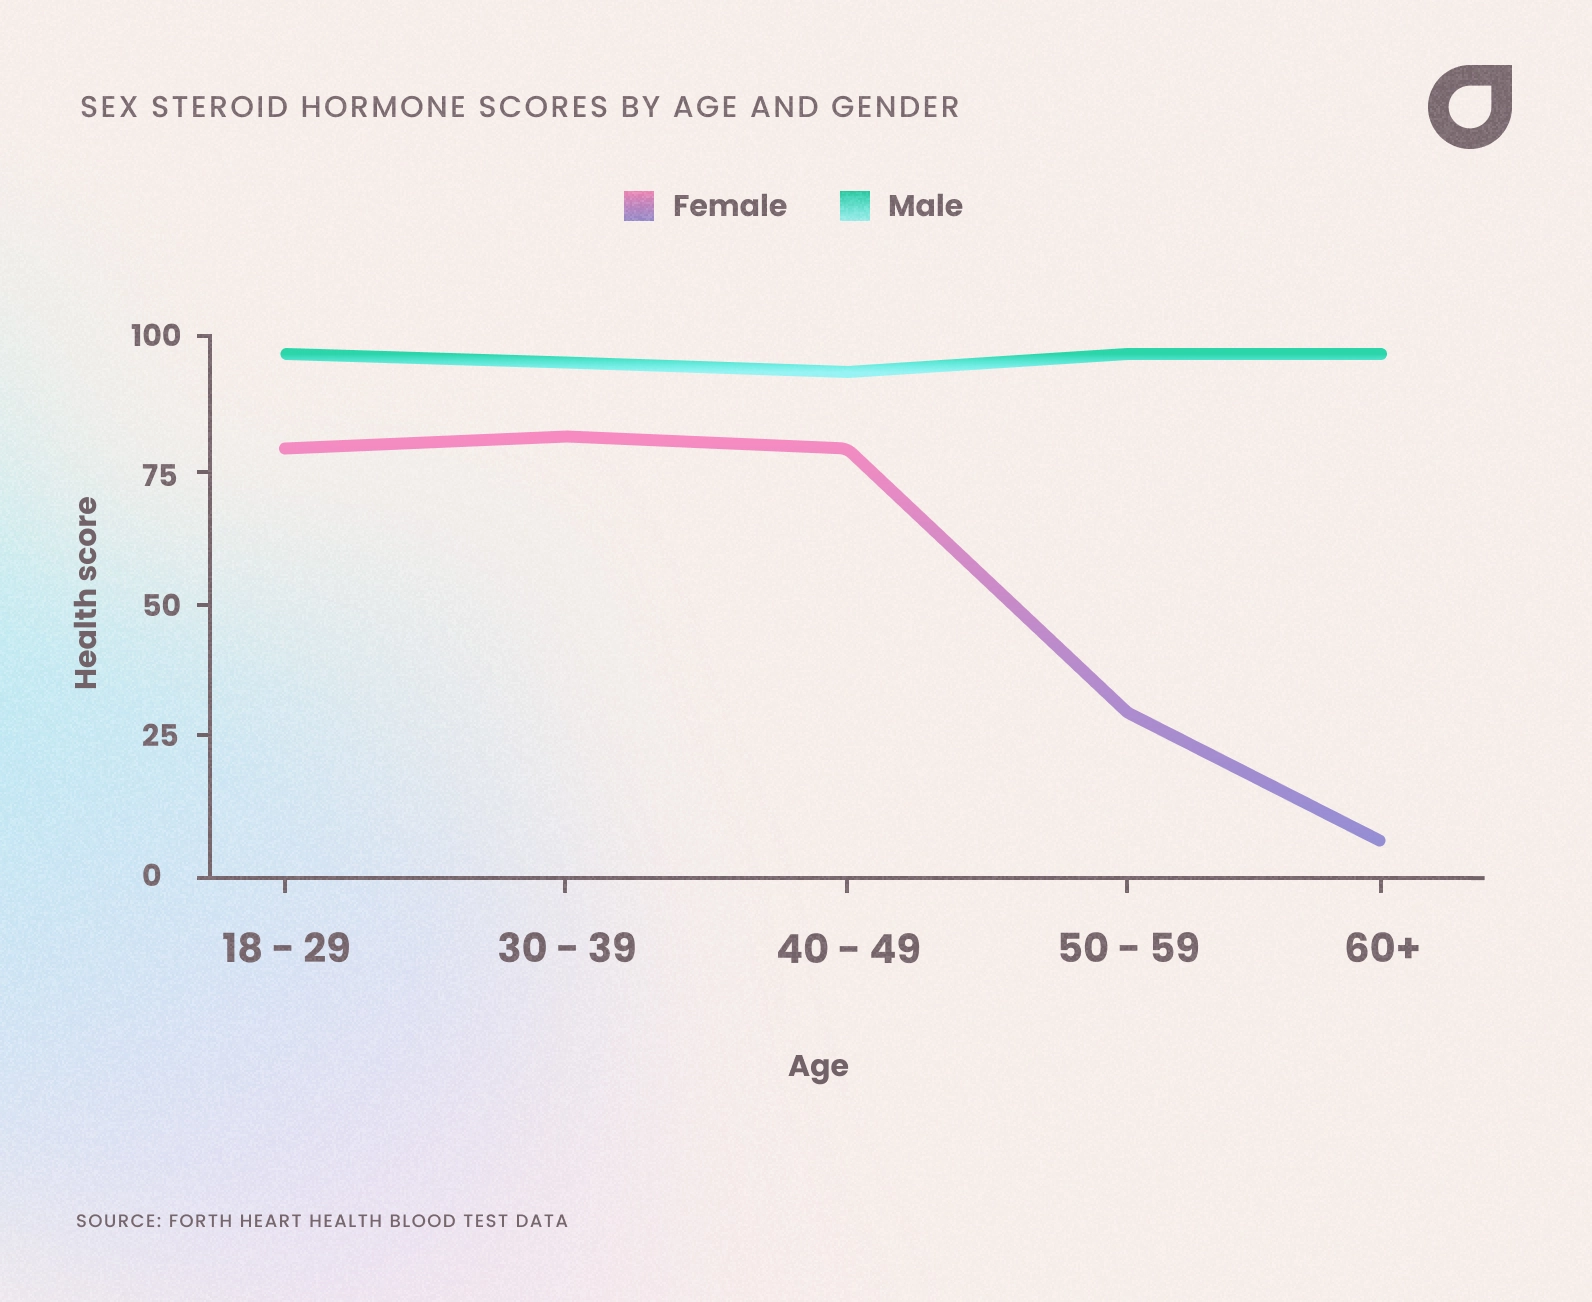
As can be seen in the table below, women’s median hormone scores drop sharply after menopause, falling from 77-79 in pre-menopause to 11 by the age of 60+. Menopause leads to a dramatic reduction in oestrogen levels, which directly impacts heart health by influencing lipid metabolism, blood vessel elasticity, and overall cardiovascular risk. This decline in oestrogen is therefore the main driver of the sharp drop in heart health scores observed in post-menopausal women.
In comparison, men exhibit a more gradual decline in testosterone with age, often referred to as “andropause”. This has less dramatic health consequences compared to the sharp hormonal shifts women face during menopause, helping men to maintain a relatively stable median hormone across all age brackets.
| Table 10: Median Sex Steroid Hormone Scores by Age & Gender | ||
| Median Sex Steroid Marker Scores | ||
| Age Bracket | Female | Male |
| 18-29 | 77 | 94 |
| 30-39 | 79 | 93 |
| 40-49 | 77 | 91 |
| 50-59 | 29 | 94 |
| 60+ | 11 | 94 |
Based on blood test data from 2,600 Forth customers
"This is where we really start to see how our hormonal health underpins our heart health. Throughout the data set, you will have seen differences between men and women in each of the categories. The main reason for these differences and the reason we see a significant worsening in post-menopausal women is the impact of these sex hormones. Although not as obvious, the slow reduction in testosterone levels in men also has an effect on lipid levels."
Menopause is a critical phase in a woman’s life that brings about profound hormonal changes, particularly a sharp decline in oestrogen levels. These changes significantly impact heart health, making menopausal women more susceptible to cardiovascular issues than their premenopausal counterparts.
Oestrogen plays a vital role in heart health by:
Supporting healthy cholesterol regulation in the liver.
Maintaining blood vessel elasticity.
Reducing inflammation and protecting against atherosclerosis.
By studying the heart health of peri- and postmenopausal women, we can gain valuable insights into how hormonal changes affect cardiovascular risk and identify interventions, like hormone replacement therapy (HRT), that could mitigate these risks.
The data below shows a distinct improvement in heart health scores for women over 40 within this study who use hormone replacement therapy (HRT) compared to those who do not.
| Table 11: The Use of HRT and Heart Health Score | ||
| Women over 40 | Not on HRT | On HRT |
| Heart Health Score | 72 | 78 |
Based on blood test data from 2,600 Forth customers
HRT has many benefits for peri/menopausal women, but perhaps one few people recognise is the potential for improved heart health, due to the protective effects of oestrogen.
Our data highlights the significant benefits of HRT for menopausal women, showing improved glucose control and lipid profiles—key factors in reducing cardiovascular disease risk. Without the protective effects of oestrogen provided by HRT, women are more likely to experience these adverse changes, underscoring the value of HRT in supporting heart health.
| Table 12: Relationship between HRT and Component scores for women over 40 | ||
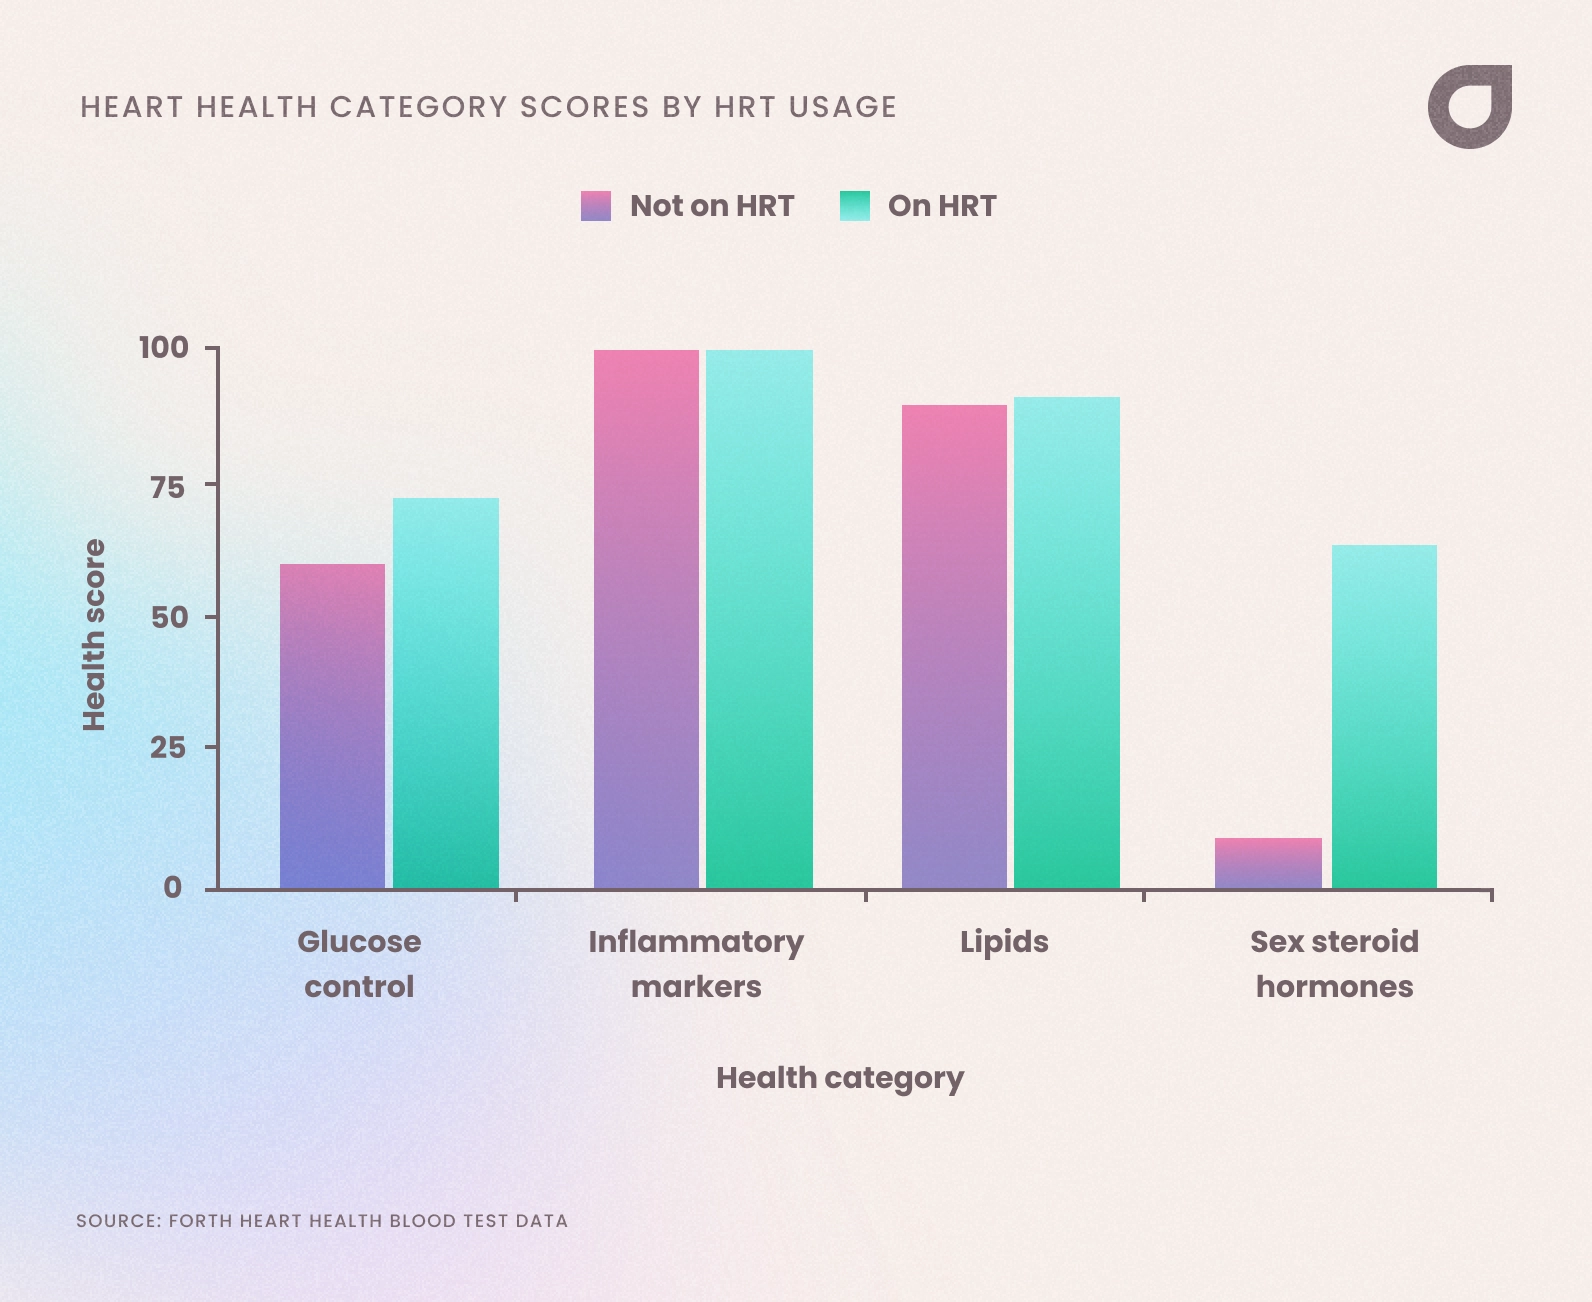
| Component | Not on HRT | On HRT |
| Glucose Control | 60 | 72 |
| Inflammatory Markers | 100 | 100 |
| Lipids | 88 | 90 |
| Sex Steroid Hormones | 11 | 67 |
Based on blood test data from 2,600 Forth customers
The table above illustrates the significant impact of HRT on key health metrics for women over 40, particularly in the area of glucose control.
Sex Steroid Hormones: Scores increase dramatically, from 11 for women not using HRT to 67 for those who are.
Cholesterol Profiles: HRT reduces LDL (bad cholesterol) and increases HDL (good cholesterol), improving lipid balance with scores rising from 88 to 90.
Glucose Regulation: Enhanced insulin sensitivity and better blood sugar control are evident in higher scores for glucose regulation which jumps from 60 to 72[2].
Overall Cardiovascular Risk: HRT addresses the primary heart health challenges associated with menopause, reducing the risk of cardiovascular disease.
Additionally, HRT helps alleviate menopause-related symptoms such as fatigue and joint pain, which often promote positive lifestyle changes like increased physical activity. These changes further support long-term heart health and overall well-being.
In conclusion, the data supports HRT’s potential to significantly improve women’s heart health during peri/post-menopause. While it may not be suitable for all women, when used appropriately, HRT can counteract the cardiovascular effects of oestrogen loss, increasing the number of years women spend in good health and enhancing their quality of life.
Our data highlights a clear trend: heart health scores decline steadily with age, underpinning the need for early intervention to maintain good cardiovascular health. Both men and women experience this decline, but the impact is more pronounced in certain life stages and genders, particularly during menopause for women.
| Graph 1: Heart Health Scores by Age and Gender | |||
| Age Group | Female | Male | Average |
| 18-29 | 82 | 84 | 83 |
| 30-39 | 82 | 80 | 80 |
| 40-49 | 78.5 | 76 | 78 |
| 50-59 | 75 | 77 | 75 |
| 60+ | 70.5 | 74.5 | 73 |
Based on blood test data from 2,600 Forth customers
The 18–29 age group demonstrates the highest median heart health score of 83, reflecting optimal cardiovascular health in early adulthood. However, as individuals age, scores steadily decrease, with the 60+ age group showing a median score of 73, a marked decline.
Gender Differences in Heart Health
Men vs. Women: Men consistently maintain slightly higher heart health scores compared to women across all age brackets, with a median difference of about 2 points.
Menopause Impact: Women experience a significant decline in heart health during the 50–59 age bracket, dropping from a median score of 82 in younger years to 75. This decline aligns with the onset of menopause, highlighting the critical role of oestrogen in supporting cardiovascular health.
Glucose Control: Age-Related Decline
Steady Decline with Age: Glucose control scores drop significantly as individuals age, with a median score of 79 in the 18–29 age group decreasing to 60 by age 60+.
Gender Patterns: While both genders experience declines, women generally maintain slightly better glucose control than men until their 60s. The data suggests the use of HRT greatly supports Glucose Control.
Cholesterol: Declining Lipid Profiles with Age
Age-Related Decline: Lipid scores show a steady decrease across age groups, particularly in men, with women maintaining higher scores due to the protective effects of oestrogen until menopause.
Gender Differences: Women consistently outperform men in lipid health, with a median score of 91 compared to 79 for men. This gap narrows significantly after menopause.
The age-related declines in glucose control and cholesterol profiles are significant contributors to the overall decline in heart health. These findings highlight the need for targeted interventions, such as:
Lifestyle Changes: Incorporating regular exercise, balanced nutrition, and weight management to support glucose regulation and lipid profiles.
Regular Monitoring: Tracking biomarkers like HbA1c and cholesterol levels to identify early signs of decline.
Medical Interventions: Exploring options such as hormone replacement therapy (HRT) for post-menopausal women to mitigate the effects of declining oestrogen.
By addressing these factors early, individuals can take proactive steps to preserve heart health and reduce the risk of age-related cardiovascular diseases.
Body Mass Index (BMI) is a key factor influencing heart health, with higher BMI often linked to poorer cardiovascular outcomes. Obesity, in particular, is a major driver of heart disease.
According to a report by the UK Government (May 2024), 64% of adults in England are now classified as overweight or obese, up from 61.2% in 2015-2016. This alarming trend underscores the growing need to address weight-related health risks.
In the current beta version of HealthCoachTM, BMI is not automatically factored into the Heart Health Score (automation in V2 due for release in April 2025). We therefore extracted BMI scores for participants and correlated them against heart health scores.
This analysis of BMI data collected from Forth customers highlights a clear relationship between BMI and heart health scores:
| Table 13: Heart Health Score according to BMI range | ||
| BMI Name | BMI Range | Heart Health Score |
| Underweight | <18.5 | 80 |
| Healthy | 18.5 – 24.9 | 82 |
| Overweight | 25 – 29.9 | 77 |
| Class 1 obesity | 30 to 34.9 | 70 |
| Class 2 obesity | 35 to 39.9 | 62 |
| Class 3 obesity | 40+ | 54 |
Based on blood test data from 2,600 Forth customers
As BMI increases, it negatively affects several biological systems that are critical for maintaining heart health. These include:
As BMI increases, so does the likelihood of conditions like high cholesterol, insulin resistance, inflammation and hormone imbalance —all of which strain the cardiovascular system, leading to lower heart health scores in the higher BMI categories.
Breaking down heart health data by region reveals significant differences across the UK, with some regions demonstrating better outcomes than others.
Scotland emerges as the leader in our heart health scores, with a median score of 80, while England lags behind at 78. A large percentage of participants (above 70%) in Scotland, Wales and England scored ‘Good’ range for heart health. However, there was a significant drop for participants living in Northern Ireland, with a huge 44% scoring below the ‘Good’ range.
| Table 14: Heart Health Scores by Country & Category | |||
| Country | Median Score | % Good (71 or above) | % Low (70 or below) |
| Scotland | 80 | 71% | 29% |
| Wales | 79 | 71% | 29% |
| England | 78 | 72% | 28% |
Based on blood test data from 2,600 Forth customers
Within England, regional disparities are evident. The North East marginally leads over London with an average score of 81, while the West Midlands trails at 76.
| Region | Median Score |
| London | 80 |
| East Midlands | 79 |
| East of England | 78 |
| South East | 78 |
| North West | 77 |
| South West | 77 |
| Yorkshire and The Humber | 77 |
| West Midlands | 76 |
Based on blood test data from 2,600 Forth customers
Looking at individual components provides deeper insights into the factors driving these regional variations:
Inflammatory Markers
The highest scores (93) are in the East Midlands, South West, and Yorkshire and The Humber, while Northern Ireland has the lowest score (88).
Lipids (Cholesterol and Triglycerides)
Scores for lipid health range from 70 in Northern Ireland to 81 East of England, London, and Scotland.
Glucose Control (HbA1c)
Most regions score consistently around 71, with the North West scoring the lowest (68) and Wales the highest (74).
Sex Steroid Hormones
London leads with a score of 77, while Northern Ireland and the West Midlands lag behind at 64.
The analysis reveals regional disparities in heart health across the UK, with some areas consistently performing better than others.
Top-Performing Regions
London, the East Midlands, and the East of England stand out with strong scores across multiple components, including glucose control, lipids, and sex steroid hormones. These regions benefit from better overall health outcomes, potentially reflecting greater access to healthcare, healthier lifestyles, and lower levels of deprivation.
Underperforming Regions
North West and West Midlands consistently show lower scores in several key health categories, such as glucose control and lipids. These regions also have higher levels of deprivation, as evidenced by the English Indices of Deprivation, which link socioeconomic challenges to poorer health outcomes.
| Table 15: Component Scores by Region | ||||
| Region | Inflammatory Markers | Lipids | Glucose Control | Sex Steroid Hormones |
| East Midlands | 93 | 80 | 71 | 72 |
| East of England | 90 | 81 | 71 | 73 |
| London | 91 | 81 | 71 | 77 |
| North West | 90 | 78 | 68 | 68 |
| South East | 91 | 80 | 70 | 70 |
| South West | 93 | 80 | 72 | 68 |
| West Midlands | 91 | 76 | 69 | 64 |
| Yorkshire & The Humber | 93 | 77 | 71 | 70 |
Regions with higher levels of income, education, and access to resources often have better health outcomes. Wealthier areas may have more access to healthier food, exercise opportunities, and healthcare services, contributing to better scores in lipid levels, glucose control, and overall health.
Regions with more comprehensive healthcare systems, more frequent health screenings, and better preventive care are likely to see better scores. For instance, regions with better access to specialists and early detection programs might perform better in areas like cholesterol management and glucose control.
Dietary habits, physical activity levels, and smoking or alcohol consumption vary by region and can significantly impact health markers such as inflammatory markers, cholesterol, and blood sugar. Regions with more health-conscious populations might have better scores in lipids and glucose control.
Certain cultural practices or norms related to diet, exercise, and healthcare utilisation can influence health outcomes. Some regions might emphasise healthy lifestyles or prioritise routine health checks, which would reflect better blood test scores.
Air quality, pollution, and the built environment can impact inflammatory markers and general health. For example, regions with higher levels of pollution might see higher inflammation-related scores, while areas with more green spaces may promote better physical activity and overall health outcomes.
February is World Heart Month, a time to raise awareness of the critical role heart health plays in preventing premature deaths. In February last year, MPs debated the pressing issue of premature deaths caused by heart and circulatory diseases, highlighting concerning data from leading health organisations.
The British Heart Foundation estimates that 7.6 million people in the UK are living with heart and circulatory diseases.
NHS England reports that cardiovascular disease (CVD) accounts for one in four premature deaths (under 75 years) in the UK.
According to the Office for National Statistics (ONS), coronary heart disease (ischaemic heart disease) was the second leading cause of death in the UK in 2022 and the leading cause of death among men.
Data from the Department of Health and Social Care reveals significant regional disparities in premature deaths from CVD which is consistent with our findings:
The national average for premature deaths in England is 77.8 per 100,000 people.
North West has one of the highest rates at 97.2 per 100,000, nearly a quarter higher than the national average.
Regions with the lowest rates include the South East (63.1 per 100,000) and South West (66.4 per 100,000).
Heart health is a pressing public health issue, and the data underscores the importance of early detection, prevention, and management of cardiovascular risk factors. Addressing regional disparities, improving access to healthcare, and promoting heart-healthy lifestyles are critical steps in reducing the burden of heart disease across the UK.
Efforts such as raising awareness during World Heart Month and ongoing policy discussions can help drive change and improve outcomes for millions of individuals at risk.
Dr Thom Phillips, Clinical Director of Forth states:
“Cardiovascular health is a cornerstone of overall well-being. Heart disease, stroke, and other cardiovascular conditions remain the leading causes of death globally. While genetic factors play a role, numerous lifestyle factors significantly influence our risk of developing these conditions. By making conscious choices and adopting healthy habits, we can all significantly reduce our long-term cardiovascular health risks.
One of the most crucial lifestyle factors is diet. A balanced diet rich in fruits, vegetables, whole grains, lean proteins, and healthy fats can help regulate cholesterol levels, blood pressure, and weight. Limiting saturated and trans fats, excessive sodium, and sugary drinks is essential. Consuming a Mediterranean-style diet, characterised by its emphasis on plant-based foods, has been shown to have beneficial effects on cardiovascular health.
Regular physical activity is another cornerstone of cardiovascular health. Engaging in at least 150 minutes of moderate-intensity exercise or 75 minutes of vigorous-intensity exercise per week can lower blood pressure, improve cholesterol levels, and reduce the risk of heart disease and stroke. It’s recommended that you incorporate 2 strength training sessions per week and although not directly targeted at cardiovascular health these sessions can also enhance cardiovascular health by increasing muscle mass which stimulates neo-vascularisation (new blood vessel growth) and improves metabolic function.
Maintaining a healthy weight is crucial for cardiovascular health. As we’ve already discussed, obesity and overweight are significant risk factors for heart disease, stroke, and type 2 diabetes. By balancing calorie intake with energy expenditure through exercise, individuals can achieve and maintain a healthy weight.
Managing stress is also important for cardiovascular health. Chronic stress can contribute to high blood pressure, increased heart rate, and unhealthy lifestyle choices. Effective stress management techniques, such as meditation, yoga, deep breathing exercises, and spending time in nature, can help reduce stress levels and improve overall well-being.
Regular blood testing can be a valuable tool for monitoring these risk factors in the long term. If you’re already in a good spot, checking these biomarkers on an annual basis can keep you on track, but if you’ve got areas that need improving then increasing the frequency of these tests can help steer you towards your improved health goals. What’s really key is that the early detection and management of cardiovascular conditions can prevent serious complications later in life.”
Some things that increase your risk of poor heart health can be avoided with lifestyle changes, but others you may inherit, such as your ethnic background or a family history of cardiovascular disease.
Here are key factors that lead to poor heart health:
High blood pressure
Smoking
High cholesterol
Diabetes
Lack of exercise
Being overweight or obese
Dr Thom Philips, Clinical Director at Forth, outlines the key actions people can take to keep your heart healthy:
Monitoring your heart health is essential for understanding your risk of cardiovascular disease and making proactive changes. With our at-home blood tests, you can easily check key biomarkers linked to heart health, such as HDL and LDL cholesterol levels.
If you’re focused specifically on your heart health, our Heart Health Blood Test is the ideal choice. It provides insights into vital heart health metrics, enabling you to identify and address potential concerns early.
For a broader understanding of your overall health, our Advanced Health Check examines multiple areas of wellbeing, including heart health, to give you a complete picture of your health.

Check your heart health with this at-home Heart Health Blood Test. The heart health check measures key markers like total cholesterol, HDL, LDL, and triglycerides, providing vital insights into your heart health. Ideal for anyone looking to proactively manage their risk of heart disease, this easy-to-use cholesterol test kit delivers fast, accurate results from a simple finger-prick sample. Your sample is analysed by an accredited NHS laboratory in the UK, ensuring reliable results.
AutoDraw
Test and track your heart health with our at-home heart health blood test.
£76
Thom works in NHS general practice and has a decade of experience working in both male and female elite sport. He has a background in exercise physiology and has published research into fatigue biomarkers.

Dr Thom Phillips
Chief Medical Officer