
AutoDraw
Female Hormone Imbalance Test
This single-day test gives a simple snapshot of your key female hormones along with thyroid function.
11 Biomarkers
£89
32 mins read
Luteinising hormone (LH) is a sex hormone made by your pituitary gland. Together with follicle-stimulating hormone (FSH), it drives ovulation in women and testosterone production in men. An LH blood test shows how well that system is working. To show what LH looks like in practice, this page draws on Forth customer test results collected between January 2021 and June 2026 in the UK, alongside published clinical guidance.
Written by Dr Thom Phillips
September 23, 2026
| What it stands for | Luteinising hormone (US spelling: luteinizing). Also known as lutropin. |
| Where it’s made | The anterior pituitary gland, a pea-sized gland at the base of your brain. |
| What it does | Triggers ovulation in women; tells the testes to make testosterone in men. |
| Typical level | Around 7–8 IU/L in women before menopause, around 5 IU/L in men, and much higher after menopause. |
| Why test it | Irregular or absent periods, fertility problems, suspected PMOS, perimenopause symptoms, or low testosterone. |
Luteinising hormone is a gonadotropic hormone produced and released by the anterior pituitary gland. It has important roles in the sexual health and function of both men and women.
LH works alongside Follicle-Stimulating Hormone (FSH), signalling to the sexual organs (the ovaries or the testes) to start the processes that support your reproductive health:
LH is produced and released by the anterior pituitary gland, the front portion of a pea-sized gland sitting at the base of your brain, just behind the bridge of your nose. But the pituitary doesn’t act alone. The chain starts one step higher, in the hypothalamus, which releases gonadotropin-releasing hormone (GnRH) in pulses. Those pulses tell the pituitary to release LH into the bloodstream. From there, LH travels to its target organs: the ovaries or the testes.
Once it arrives, LH acts on very specific cells:
This whole system (hypothalamus, pituitary, gonads) is known as the HPG axis. It’s a loop rather than a one-way street: the sex hormones produced at the bottom signal back up to the brain, adjusting how much LH is released next.

The HPG axis. The solid path is the signal travelling down; the dashed path is the feedback that rises back to the brain.
“Serum LH” simply means LH measured in your blood. Serum is the liquid part of blood left after clotting. It isn’t a different hormone, and a serum LH level is the same thing as an LH level.
If you see LH on a blood test report, it’s the concentration of luteinising hormone circulating in your blood at the moment your sample was taken. Forth reports LH in IU/L (international units per litre). Some labs use mIU/mL instead. The two are numerically identical, so an LH of 7.4 IU/L is the same as 7.4 mIU/mL. No conversion needed.
LH’s job depends on where it lands. The hormone is identical in everyone; the difference is the target. In women it drives the monthly release of an egg and then supports the structure left behind. In men it’s a steady, continuous signal to keep testosterone production going. In children, LH stays very low until puberty, when rising pulses of it are one of the triggers that start sexual development.
In menstruating women, LH helps regulate the menstrual cycle. During the first two weeks of the cycle, LH and FSH stimulate the ovarian follicles to produce oestradiol. Once a critical level of oestradiol is reached, LH levels surge around day 14, triggering the release of an egg from the ovary. This is ovulation [1].
After ovulation, LH acts on the corpus luteum, the collection of cells the egg was released from, prompting it to produce more progesterone. Progesterone supports the early stages of pregnancy if fertilisation happens. If it doesn’t, hormone levels fall and the cycle begins again [2].
Put simply, LH stimulates four things:
So LH doesn’t produce these hormones itself. It’s a messenger: it tells other tissues to produce them.
LH sits inside a feedback loop, and this is what makes it behave in a way that can look contradictory at first.
For most of the cycle, oestrogen suppresses LH. As oestradiol rises during the follicular phase, it signals back to the brain to ease off, keeping LH low. This is classic negative feedback. But once oestradiol climbs past a certain threshold and stays there for around 48 hours, the effect flips. The same hormone that was holding LH down now triggers a sharp release of it. This switch to positive feedback is what produces the mid-cycle LH surge and, therefore, ovulation. Progesterone, released after ovulation, then helps shut the surge down again.
In men the loop is simpler and steadier: testosterone signals back to the brain, and when testosterone falls, LH rises to compensate.
This is also why anything that lowers oestrogen or testosterone tends to raise LH. The brain is pushing harder on a system that isn’t responding.
Luteinising hormone matters for both male and female fertility:
There’s no single “good” LH level for conceiving. What matters is whether the surge is happening at all, and whether it’s happening at a predictable point in the cycle. This is why LH is usually interpreted alongside progesterone, FSH and oestradiol rather than on its own.
During perimenopause, ovarian function declines and hormones fluctuate. LH levels can become erratic across the cycle, contributing to irregular periods and to perimenopausal symptoms.
Persistently high LH is also a sign of reduced ovarian reserve and function, meaning a woman is transitioning towards menopause. Our own data shows this transition clearly (see the section on normal LH levels in women by age below).
LH is almost never interpreted on its own. Its partner hormone, FSH, comes from the same gland and acts on the same organs, and doctors read the two as a pair.
| LH (luteinising hormone) | FSH (follicle-stimulating hormone) | |
| Where it’s made | Anterior pituitary gland | Anterior pituitary gland |
| Main job in women | Triggers ovulation; supports the corpus luteum and progesterone | Grows and matures the ovarian follicles |
| Main job in men | Stimulates Leydig cells to make testosterone | Supports the Sertoli cells and sperm production |
| Pattern across the cycle | Sharp surge at ovulation | Gentler rise early in the cycle |
| After menopause | Rises substantially | Rises substantially, usually more than LH |
The short version: FSH grows the egg, LH releases it.

When judging whether an LH level is normal, several things have to be taken into account:
Normal ranges also vary between laboratories. The reference ranges used by Forth’s labs are:
| Group | Normal LH range |
| Pre-menopausal women | 2.4 – 12.6 IU/L |
| Post-menopausal women | 7.7 – 59 IU/L |
| Men | 1.7 – 8.6 IU/L |
Notice that the ranges for women differ depending on menopause status, not age. That distinction turns out to matter enormously, as the data below shows.
Across the Forth test results collected from women, LH is remarkably stable through the reproductive years and then climbs steeply.

Normal LH levels by age in women. Median LH stays between 7.1 and 7.5 IU/L from 18 to 44, then rises almost fivefold across the menopause transition. Bars show the median; the vertical lines show the middle 50% of results.
| Age | Median LH (IU/L) | Middle 50% of results | Number of results |
| 18–24 | 7.1 | 4.6 – 10.8 | 614 |
| 25–29 | 7.5 | 5.2 – 10.7 | 1,200 |
| 30–34 | 7.4 | 5.3 – 10.2 | 1,793 |
| 35–39 | 7.3 | 5.3 – 10.4 | 1,826 |
| 40–44 | 7.5 | 5.2 – 11.1 | 2,009 |
| 45–49 | 10.0 | 6.3 – 20.4 | 1,647 |
| 50–54 | 27.3 | 10.2 – 45.0 | 1,149 |
| 55–59 | 36.7 | 26.3 – 49.0 | 626 |
| 60+ | 34.2 | 24.9 – 43.7 | 412 |
Forth customer data, UK. Median with 25th–75th percentile.
Two things stand out. First, LH barely changes between 18 and 44. The median moves only between 7.1 and 7.5 IU/L across 27 years (a difference of less than 6%). If you’re in this age band, your age is not a useful explanation for an unusual LH result.
Second, the spread widens before the average does. At 45–49 the median is still 10.0, only slightly above the reproductive years. But the top of the middle-50% range has jumped from 11.1 to 20.4. In other words, a quarter of women in their late forties already have LH in the post-menopausal range, while half are still entirely typical. The average conceals what is really happening: the group is splitting in two.
That splitting becomes obvious once the same data is separated by menopause status.

The same age brackets split by menopause status. Forth customer data (women aged 45–59 in the UK).
| Age | Still having periods | Post-menopausal |
| 45–49 | 9.7 (n=1,392) | 21.2 (n=187) |
| 50–54 | 18.3 (n=694) | 37.8 (n=417) |
| 55–59 | 32.1 (n=88) | 37.3 (n=521) |
Median LH in IU/L. Forth customer data, UK.
At 50–54, women who are post-menopausal have roughly double the LH of women the same age who are still having periods. Quoting a single average for that age group would describe almost nobody.
There’s a subtler signal here too. Among women aged 50–54 who still consider themselves pre-menopausal, the median LH is 18.3, well above the 7.4 seen at 40–44, and above the top of the pre-menopausal reference range. These are, in all likelihood, women in the middle of the transition. Your stage matters more than your age, and one number without that context tells you very little.
For women who are still cycling, where you are in your cycle affects LH more than almost anything else.

LH across the menstrual cycle: the textbook pattern next to real customer results. Forth customer data (women with regular cycles and no hormonal contraception, UK).
| Cycle phase | Typical days | Median LH in Forth data |
| Early follicular (baseline) | 1–6 | 7.2 – 7.6 IU/L |
| Late follicular (rising) | 9–13 | 9.0 – 11.9 IU/L |
| Ovulation (surge) | 14–16 | 12.4 – 13.6 IU/L |
| Luteal phase | 18–28 | 5.6 – 8.8 IU/L |
Women with regular periods, not using hormonal contraception. Forth customer data, UK.
The surge is clearly visible in real customers, peaking on day 14, but it’s flatter than the classic textbook curve, and that’s expected rather than a problem. Each day in our data is a different group of women, not one woman followed across a month. Since not everyone ovulates on day 14, averaging across them smooths a sharp individual spike into a gentle hill. An individual’s own surge is far more dramatic than any population average can show.
As the ovaries become less responsive, they produce less oestrogen. With less oestrogen signalling back to the brain, the pituitary pushes harder and LH rises. This is why LH is high in menopause, and why it increases with age in women but not in the same way in men.
| Group | Median LH | Middle 50% of results | Number of results |
| Pre-menopausal | 7.9 IU/L | 5.4 – 12.3 | 9,161 |
| Post-menopausal | 35.0 IU/L | 21.0 – 47.5 | 1,644 |
Forth customer data, UK.
Post-menopausal LH is around four and a half times pre-menopausal levels. But there is an important limit here. People often ask what LH level indicates menopause or perimenopause, hoping for a threshold. There isn’t a reliable one. In perimenopause, LH swings unpredictably from cycle to cycle: it can be menopausal one month and entirely normal the next. This is exactly why NICE guidance advises against using FSH or LH to diagnose menopause in women over 45, where the diagnosis is made on symptoms and menstrual pattern instead. In women under 45, and particularly under 40, hormone testing has more of a role, but it’s still interpreted alongside symptoms rather than on its own.
If you’re trying to understand perimenopause, a single LH reading is one of the least reliable tools available. A test that maps several hormones across the cycle, such as MyFORM® Perimenopause, gives a much better picture than one snapshot.
Among post-menopausal women in our data, those taking HRT had noticeably lower LH than those who weren’t, as shown in the table below.
| Group | Median LH | Middle 50% of results |
| On HRT | 29.6 IU/L | 14.3 – 44.2 |
| Not on HRT | 38.2 IU/L | 28.4 – 49.5 |
Post-menopausal women. Forth customer data, UK.
HRT supplies oestrogen from outside the body, which restores some of the feedback signal to the brain and eases the pressure on the pituitary. The median falls by around 22%, This is consistent with the expected effect of oestrogen on the hypothalamus and pituitary, although LH can remain above pre-menopausal reference ranges even when HRT is effective. Published research shows the same effect.[^9]
Does that mean HRT should be adjusted until LH or FSH returns to a pre-menopausal level? Not based on current evidence or guidance. Although LH and FSH fall in response to oestrogen, there is no established LH or FSH target for HRT treatment. Unlike TSH in hypothyroidism, these hormones have not been validated as markers for deciding the optimal HRT dose.
Worth knowing if you’re on HRT: UK guidance recommends using the lowest effective HRT dose, with treatment guided mainly by symptom control, side effects and individual circumstances rather than by targeting a particular LH, FSH or oestradiol level. Blood oestradiol testing can sometimes be useful, for example if symptoms persist and poor absorption is suspected. So, if your LH remains above a pre-menopausal reference range while taking HRT, that result alone does not mean your dose is too low.[^11]
LH is not a pregnancy test, and this causes a lot of confusion. Once pregnancy is established, LH is suppressed rather than raised. The hormone that rises is hCG (human chorionic gonadotropin), which takes over the job of maintaining the corpus luteum.
The confusion comes from home ovulation tests. LH and hCG are structurally similar enough that an ovulation predictor kit can show a positive result in early pregnancy, because it’s picking up hCG. That’s a cross-reaction, not a high LH level, and an ovulation kit should never be used as a pregnancy test. If you want to know whether LH levels after ovulation mean you’re pregnant, the answer is that an LH blood test can’t tell you. A pregnancy test measuring hCG can.
Across Forth test results from men, LH follows a shallow U-shape rather than the steep climb seen in women:
| Age | Median LH (IU/L) | Middle 50% of results | Outside the normal range |
| 18–24 | 5.4 | 3.6 – 6.9 | 26.4% |
| 25–29 | 5.2 | 3.4 – 7.0 | 28.2% |
| 30–34 | 4.8 | 3.1 – 6.5 | 27.6% |
| 35–39 | 4.3 | 0.5 – 6.2 | 34.6% |
| 40–44 | 4.7 | 2.7 – 6.5 | 29.5% |
| 45–49 | 4.6 | 2.9 – 6.4 | 24.5% |
| 50–54 | 4.8 | 3.0 – 6.7 | 26.8% |
| 55–59 | 5.1 | 3.4 – 6.9 | 25.4% |
| 60+ | 5.6 | 4.1 – 7.8 | 26.0% |
Forth customer data, UK. Normal range 1.7–8.6 IU/L.
LH dips through the thirties, bottoming out at 4.3 between 35 and 39, then rises steadily from the mid-forties. That later rise is the male equivalent of what happens to women at menopause, only far more gradual: as the testes become less efficient, less testosterone signals back to the brain, and LH increases to compensate.
Around one man in four sits outside the reference range but, unlike women, more often below it than above. Low results peak at 26.4% between 35 and 39, then become less frequent after 40, while raised results roughly double by 60+, reaching 19.6%.
LH levels naturally fluctuate, particularly during the menstrual cycle, so a high or low result isn’t automatically good or bad. A surge midway through your cycle could simply mean you’re about to ovulate (useful news if you’re planning a pregnancy). That’s why factors like your age, sex and menstruation status have to be considered before interpreting any result.
If you’ve tested twice and got two quite different numbers, that’s usually normal rather than an error. LH is released in pulses, not as a steady stream. The hypothalamus sends GnRH signals every 60 to 90 minutes, and LH follows. A blood test captures a single moment in that rhythm, so two samples taken hours apart can legitimately differ.
On top of that, LH varies:
None of this means the test is unreliable. It means a single number is a snapshot, and it needs to be read alongside your symptoms, your cycle day and your stage of life.
Common influences on LH levels are:
Hormonal contraception is one of the most common reasons for an unexpectedly low LH result.
| Group | Median LH | Middle 50% of results |
| Not on hormonal contraception | 8.2 IU/L | 5.7 – 12.6 |
| On hormonal contraception (all types) | 6.9 IU/L | 3.8 – 11.0 |
| — Combined pill or vaginal ring | 4.5 IU/L | 1.3 – 7.7 |
| — Progesterone-only methods | 7.2 IU/L | 4.3 – 11.2 |
Women. Forth customer data, UK.
The type matters far more than the fact of using contraception at all. Combined methods roughly halve LH: a median of 4.5 against 8.2 in women using nothing, with a quarter of results below 1.3 IU/L. That’s exactly how they work: by suppressing the pituitary signal, they prevent ovulation. Progesterone-only methods barely shift it, at 7.2 against 8.2. Many of these methods don’t reliably suppress ovulation, so the LH signal continues.
If you’re on the combined pill, a low LH result is expected rather than a sign of a problem, and it also means the test can’t tell you much about your underlying cycle.
Among women tested on days 2–5 of their cycle and not using contraception, LH is somewhat lower in the higher BMI bands:
| BMI band | Median LH | Middle 50% of results |
| Under 18.5 | 7.6 IU/L | 6.1 – 10.2 |
| 18.5 – 24.9 | 7.7 IU/L | 5.9 – 10.0 |
| 25 – 29.9 | 7.2 IU/L | 5.3 – 9.2 |
| 30 and over | 6.0 IU/L | 4.6 – 8.4 |
Women, early-cycle tests only. Forth customer data, UK.
This may run against expectation, since higher body weight is often associated with PMOS and PMOS with raised LH. The likely explanation goes back to the feedback loop described earlier. Fat tissue produces oestrogen, so a higher body weight tends to mean a slightly higher baseline oestradiol level, and more oestradiol signalling back to the brain means less LH released. Lower LH in the higher BMI bands isn’t an anomaly. It’s the same negative feedback working exactly as it should. It also fits published work showing the classic raised LH pattern in PMOS is seen more often in leaner women.
"Two important caveats. This shows association, not cause: we can't tell from this data whether weight affects LH, whether something else affects both, or whether it reflects who chooses to buy a test. And a lower median across a group says nothing about any individual. If you're concerned about your weight and your hormones, that's a conversation for your GP rather than something to act on from a chart. "
High luteinising hormone can be a sign that your sexual organs aren’t producing enough of the hormones needed to regulate reproduction, so the brain increases the signal in response.
In women this happens most often around midlife, as part of the menopause transition, and it produces a figure that looks alarming written down: half of women aged 50 to 54 return an LH result outside the pre-menopausal reference range. That number is worth sitting with for a moment, because it says far more about the range than about the women being measured.

Where women’s LH results sit against the reference range used for their group. The share falling above it climbs steeply through the late forties and peaks between 50 and 54. Forth customer data, women, UK.
The pre-menopausal range was built around women who are still cycling regularly, so applying it to someone in the middle of the transition flags an ordinary physiological shift as though it were a fault. Nothing has gone wrong in those women. The measuring stick simply stops fitting before the biology does, and the proof is what happens next: the apparent improvement after 55 isn’t LH coming back down, it’s the point at which the wider post-menopausal range takes over and the same number is read differently.
If you’re in your late forties or early fifties and your LH has been flagged, that context matters more than the flag itself.
Most raised results in women trace back to one of these:
In men, raised LH usually means the testes are underperforming while the brain signals normally. Causes include:
High LH levels do not usually cause symptoms directly. Instead, symptoms tend to be related to the underlying cause of the hormonal imbalance.
In women they may include:
In men, the symptoms are the same as low testosterone: low libido, fatigue, reduced muscle mass, erectile difficulties and low mood.
If your LH is raised and it’s causing symptoms or affecting your quality of life, speak to your doctor for advice and treatment. Alongside that, some things may help.
Three things have reasonable evidence behind them:
Treatment targets the cause, not the number itself.
There is no medication whose purpose is simply to reduce an LH number, and there’s rarely a reason to want one. Raised LH is a signal about what’s happening underneath, so the useful question is why it’s raised, not how to suppress the messenger.
Low LH usually means the opposite problem: the pituitary or the hypothalamus isn’t sending enough signal in the first place. Doctors call this a central or hypogonadotropic pattern.
Low results are considerably more common in men than in women in our data: around one man in six overall, rising to more than one in four between 35 and 39.

How LH results fall into each category in men. Low results peak at 26.4% between 35 and 39, then become less frequent with age, while raised results roughly double by 60+. Forth customer data, UK.
The usual explanations, which differ between women and men:
As with high LH levels, low levels of luteinising hormone (LH) do not cause symptoms directly. Instead, they present through the signs of the associated hormonal imbalances. In women, this may lead to irregular or absent periods, lack of ovulation and difficulty conceiving. In men, it may cause reduced libido, erectile difficulties, fatigue, loss of strength and reduced muscle mass.
What points to low rather than high LH is usually the context, not the symptoms:
| Suggests low LH | |
| A trigger | Hormonal contraception, weight loss, very low body weight, heavy training, severe stress |
| The pattern | Periods stopping completely rather than becoming irregular |
| Age | Menopausal-type symptoms well under 40 |
| Other signs | Headaches or vision changes, milky nipple discharge, reduced sense of smell |
| Medications | Opioids, corticosteroids, current or previous anabolic steroid use |
Some lifestyle factors influence LH. The clearest is energy availability. RED-S is caused by an imbalance between energy intake and energy expenditure: for example, low calorie intake combined with a high level of exercise, so that the body isn’t adequately fuelled for the activity it’s doing.
RED-S can affect men and women, causing hormone imbalances including low LH, a range of symptoms, and in some cases infertility.[^10] Where this is the cause, restoring adequate fueling and reviewing training load is what allows LH to recover.
This is a signal to seek help rather than a problem to self-manage. Absent periods, persistent fatigue or a sharp fall in performance alongside a low LH result should be discussed with a GP or sports physician, not addressed by adjusting diet or training alone. Alongside that, addressing sleep, chronic stress, and alcohol intake supports the whole system.
Treatment depends on the cause. Where a pituitary problem or a condition like Kallmann syndrome is responsible, hormone treatment can be very effective, including gonadotropin therapy to stimulate ovulation in women or restore testosterone and fertility in men. This is specialist territory, prescribed and monitored by an endocrinologist or fertility specialist.
Treatment for low LH levels in males specifically often involves distinguishing a central cause from a testicular one, which is why LH is nearly always tested alongside testosterone and FSH.
An LH blood test measures the concentration of luteinising hormone circulating in your blood, reported in IU/L. It’s a simple, direct measurement with no calculation involved.
An LH test is usually requested by a doctor when a couple is finding it difficult to conceive. It’s traditionally measured from a blood sample taken from a vein in the arm, though you can also test your LH levels at home with a finger-prick sample.
What the test doesn’t do is diagnose anything on its own. It tells you the strength of the signal being sent from your brain to your ovaries or testes at one moment. Interpreting that requires knowing your sex, age, cycle day, menopause status and what medication you’re taking.
Measuring your LH levels at a specific moment in time can help you understand:
Timing changes the result more than almost anything else.
No fasting is needed for LH. Take the sample at the right point in your cycle and, for men, in the morning. If you’re using a home finger-prick kit, being well hydrated and warming your hands first makes collection much easier (see our guide to collecting a finger-prick sample).
Tell whoever is interpreting the result about hormonal contraception, HRT, fertility medication, steroids or any recent hormone treatment, since all of these change what the number means. Risks are minimal: a blood test may cause brief discomfort or slight bruising.
Your result will appear with three pieces of information: the value, the unit, and the reference range for your group.
"If your result is unexpected, or you have symptoms alongside it, take it to your GP. A single hormone value read without clinical context is one of the easiest things to misinterpret."
All these tests include luteinising hormone. Select the one that suits your needs.
Because LH is best read alongside FSH, oestradiol, progesterone and testosterone, the panel tests give a more complete picture than LH on its own.
LH is the abbreviation for luteinising hormone (spelt luteinizing in American English, with no difference in meaning). On a lab report it appears as LH, or occasionally as lutropin, its alternative clinical name. It isn’t the same as LSH or LTH, which are older or mistyped terms.
The name comes from the corpus luteum (Latin for “yellow body”), the structure left behind in the ovary after an egg is released. LH is what turns the empty follicle into the corpus luteum, and that’s what it was named after.
No, and this is a common mix-up. LH rises about two weeks before your period, at ovulation, then falls back. In the days just before bleeding starts it’s near its lowest point of the month: a median of 6.1 IU/L on day 21 in our data, against 13.6 at the surge.
There’s no universal number. What matters is the rise relative to your own baseline, which is why home ovulation kits detect a change rather than a fixed threshold. In our data the median roughly doubles at the peak, but an individual’s surge is far sharper than that population average suggests.
Typically around 24 to 36 hours from start to finish, with the egg released roughly 24 to 36 hours after the surge begins. This is why timing matters so much: a blood test taken a day either side of the peak can look entirely unremarkable.
They measure the same hormone for different jobs. A kit tests urine daily and answers one question: is the surge happening now? A blood test gives an exact figure and is read alongside FSH, oestradiol and progesterone. Use a kit to time conception; use a blood test to understand why cycles are irregular.
Not by itself, it’s a signal, not a diagnosis. In a woman of 55 it’s simply expected, and in an older man it’s common. In a woman of 30 with irregular periods, or a younger man with low testosterone, it’s worth investigating with your GP.
Not automatically. It can reduce fertility because ovulation may not happen reliably, but it’s usually treatable and often temporary once the cause is addressed.
Many women can, particularly where the cause is reversible. If you’ve been trying for a year (six months over 35) see your GP.
For most people the pituitary recovers within a few weeks to a few months. Our data shows why the starting point matters: combined methods roughly halve LH, while progesterone-only methods barely change it. After a combined method, wait until you’ve had at least one natural period before testing.
Yes. Breastfeeding raises prolactin, which suppresses the release of GnRH and therefore LH. This is why periods and ovulation often pause while breastfeeding, and why an LH test taken during this time reflects that state rather than your underlying baseline.
No, but they’re structurally similar enough to be confused by some tests. That similarity is why an ovulation kit can show a positive in early pregnancy: it’s detecting hCG, not a genuine LH surge. An ovulation kit should never be used as a pregnancy test.
It can. Sustained psychological stress acts on the hypothalamus at the top of the chain, reducing GnRH pulses and therefore LH. Combined with low energy availability or heavy training, it’s one of the more common reasons for an unexpectedly low result in a young woman with otherwise normal health.
No, LH isn’t affected by food. What does matter is timing: women should test on days 2 to 5 of the cycle for a baseline reading, and men should take the sample in the morning, ideally before 10am.
Yes. Several Forth tests measure LH from a finger-prick sample taken at home, listed below. Because LH is most informative when read alongside FSH, oestradiol, progesterone or testosterone, the panel tests give a fuller picture than LH measured on its own.
All these tests include Luteinising Hormone (LH). Select the test that suits your personal needs.
AutoDraw
This single-day test gives a simple snapshot of your key female hormones along with thyroid function.
£89
Multi-day test
Understand your hormone patterns, ovarian response and menstrual cycle health with our ground-breaking hormone mapping test.
£139
Breakthrough test
Understand if symptoms you're experiencing could be due to perimenopause with our ground-breaking hormone mapping test.
£139
AutoDraw
Whether you're thinking of trying for a baby or are struggling to conceive, we're here to help with our fertility test.
£144
AutoDraw
Check if symptoms such as irregular periods, acne, and excessive hair growth could be due to PCOS.
£175
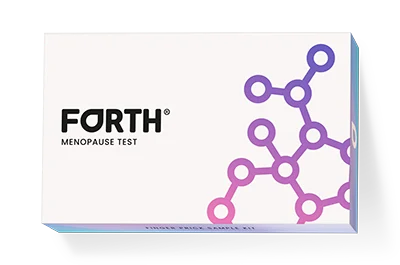
For women who have reached menopause. Checks key hormones alongside bone health and heart health.
£129
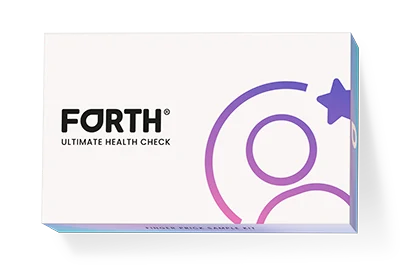
Our most comprehensive blood test. This test gives you unparalleled insights into your health.
£399
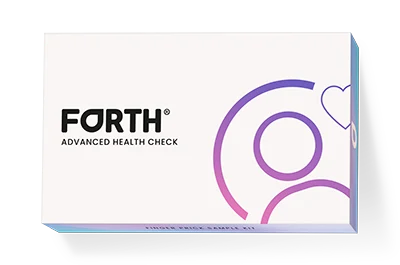
A comprehensive health test that checks bone health, heart, liver and thyroid function, energy levels, nutrition, immune & hormone health.
£167
Certified for quality & security

